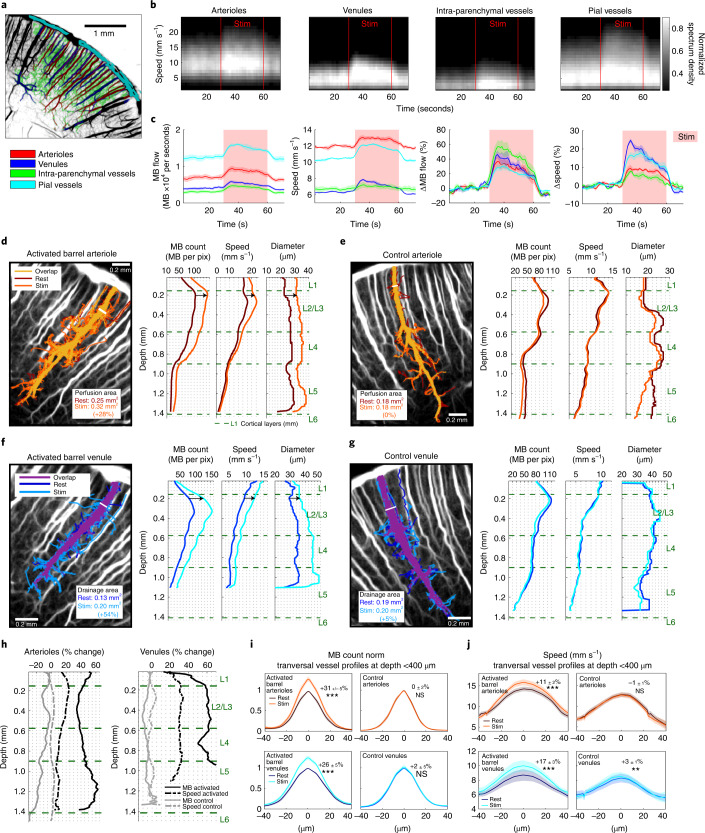
Fig. 2. Super-resolved quantification applied to MB trajectories reveals increased MB flux, speed and vessel diameter in arterioles and venules of the activated barrel cortex during functional hyperemia.
a, Subdivision of the barrel cortex into penetrating arterioles, venules, pial vessels and intraparenchymal vessels based on the super-resolved ULM maps. b, Dynamic histograms of the MB velocity distribution in the compartments defined in a during whisker stimulations (stim, n = 40 stimuli). c, Mean MB flow and speed (±s.e.m.) from n = 4 time courses obtained on ten stimulations each, either expressed as absolute value for each compartment (left), or as relative to baseline (right). d–g, Longitudinal profiles of MB count, speed and diameter during rest and stimulation periods, along an arteriole (d,e) or venule (f,g), activated site (e,g) or control site (d,f). Labeling of all MB trajectories passing through the chosen white segment at the entry of the penetrating arteriole or venule. Quantification of this perfusion of drainage area was performed using this selective set of MBs. For each blood vessel, those area for rest and stimulation periods are displayed on ULM MB count maps. h, Changes during whisker stimulation relative to rest in the MB count and speed for the blood vessels analyzed in d–g. i,j, Analysis on n = 20 arterioles (20 in the activated barrels and 20 controls) and n = 18 venules (18 in the activated barrels and 18 controls) transversal sections from n = 4 rats at a depth <400 μm from pial vessels. MB count (i) and speed (j) transversal profiles shown as mean ± s.e.m. Percentage variation relative to rest and the results from a two-sided Wilcoxon signed-rank test on this variation (null hypothesis, distribution with median equal to zero; NS, not significant, *P ≤ 0.05, **P ≤ 0.01, ***P ≤ 0.001) are given for the max MB count (activated arterioles, P = 9 × 10⁻⁵; control arterioles, P = 0.91; activated venules, P = 9 × 10⁻⁴; control arterioles, P = 0.98) and speed (P = 9 × 10⁻⁵; P = 0.55; P = 3 × 10⁻⁴; P = 0.012); n = 4 experiments (a–j).

