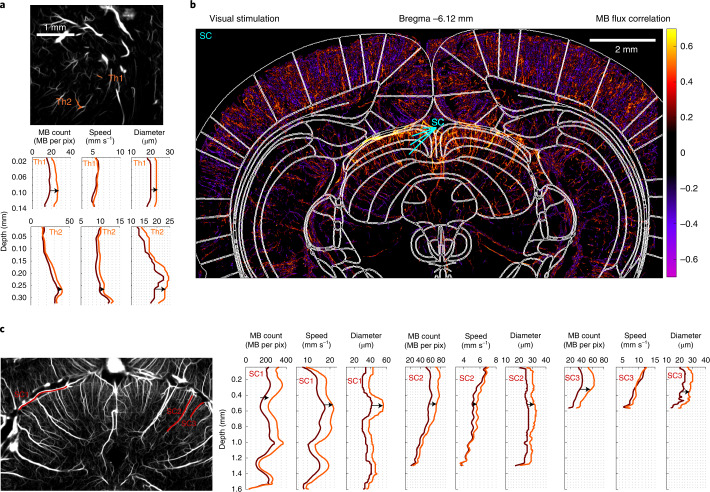
Fig. 3. Functional ULM reveals activation in subcortical structures such as VPM and VPL after whisker stimulation and SC after visual stimulation.
a, Selection of two blood vessels (orange, Th1 and Th2) within the activated thalamus displayed on an ULM MB count map. MB count, speed and diameter quantifications for rest and stimulation periods for the two blood vessels; n = 4 experiments. b, MB flux correlation map after visual stimulations overlaid with rat brain atlas52 at Bregma = −6.12 mm. c, Selection of three blood vessels (red, SC1, SC2, and SC3) within the activated SC displayed on an ULM MB count map. MB count, speed and diameter quantifications for rest and stimulation periods for the three blood vessels; n = 3 experiments (b,c).

