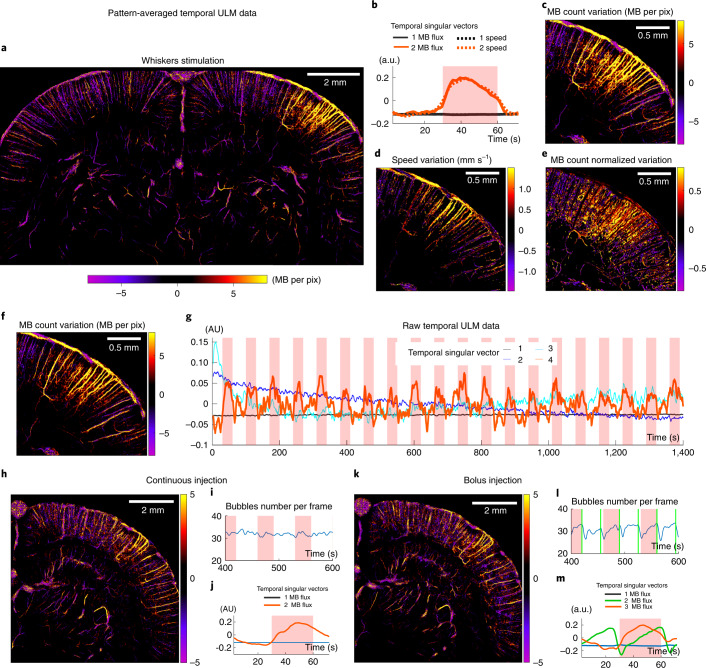
Fig. 4. Singular value decomposition of sparse dynamic ULM data extracts the spatial and temporal profile of multiple parameters during activation.
a,b, SVD analysis applied to pattern-averaged data: MB count variation map during stimulation (a) and associated temporal singular vectors (b). c–e, Zooming in on the somatosensory barrel cortex, absolute MB count variation (c), speed variation (d) and relative MB count variation (e). f,g, SVD analysis applied to the raw temporal ULM matrix (without any pattern summation, sparse signal): stimulation spatial singular vector (f) and corresponding temporal singular vectors (g). h–m, SVD analysis in continuous versus bolus injections experiments. These experiments were performed in the same rat, using either a continuous injection (i) or bolus injections every 35 s (l). Results show the spatial singular vector corresponding to stimulation (h,k) and the first SVD temporal singular vectors (j,m). n = 4 experiments (a–e), single micrograph (f–m).

