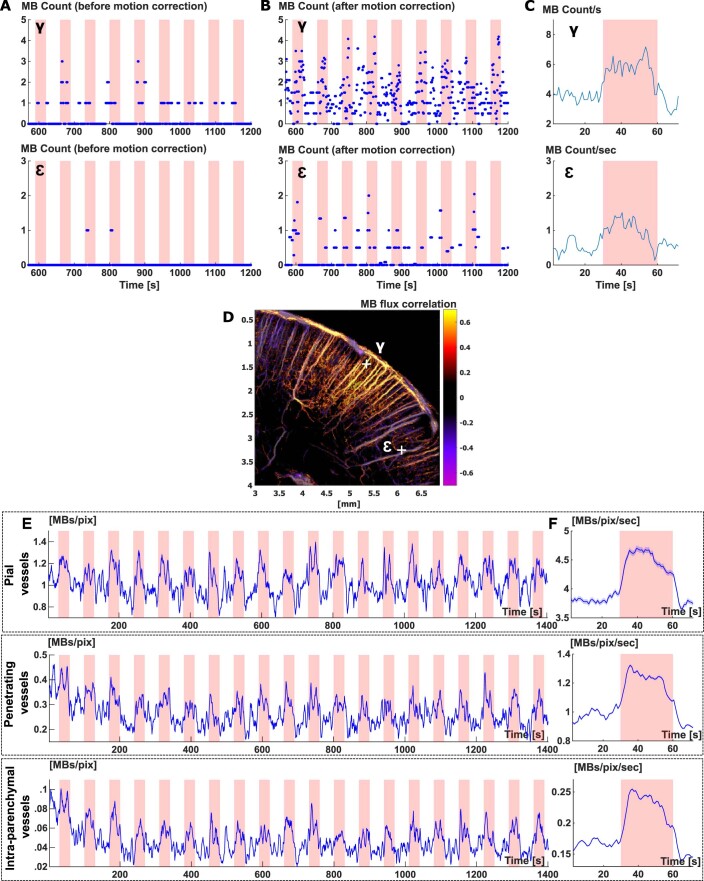
Extended Data Fig. 2. Temporal profiles of microbubble detection in typical pixels representative of pial vessels, penetrating vessels and 1st order branching capillaries.
(A) Time courses of MB count for a pixel in an arteriole (top, γ in D) and smaller blood vessel (bottom,1st order branching after descending arteriole, ε in D), illustrated in D. The red shaded intervals correspond to stimulation periods. (B) Time courses of MB count for the same pixels after spatial registration. (C) Time courses of MB flux for the same pixels after pattern summation. (D) Position of pixel γ and ε on a functional correlation map. (E) Time courses of MB count after spatial registration averaged over three different vascular compartments (pial vessels, penetrating vessels and 1st order branching capillaries). (F) Time courses of MB flux averaged over the same three vascular compartments as in (E), after pattern summation. (A-F) N = 7 experiments.

