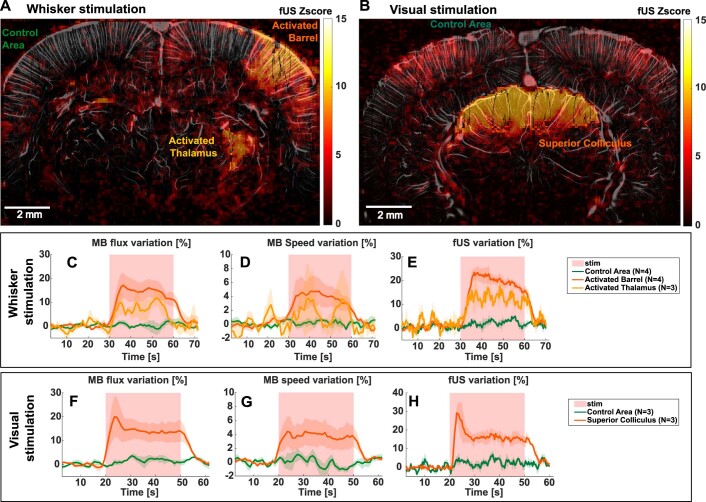
Extended Data Fig. 3. Inter-animal reproducibility: MB flux and velocity temporal responses during functional hyperemia.
(A-B) fUS imaging: examples of activated barrel (A), thalamus (A), superior colliculus (B) as well as control areas chosen for temporal responses extraction. They are shown for one whisker and one visual task-evoked experiments on a ULM MB count map overlaid with a fUS activation map. Activated zones are chosen using the Z-score with a threshold at p < 0.05 after Bonferroni correction (C-H) Quantitative fULM imaging: MB flux and velocity temporal variations in the barrel cortex (N = 4) and thalamus (N = 3) for whiskers stimulation (C-D) and superior colliculus for visual stimulation (N = 3 rats, F-G) respectively. Power Doppler signals are shown for the corresponding fUS experiments for comparison (E-H). Data are presented as mean ± SE.

