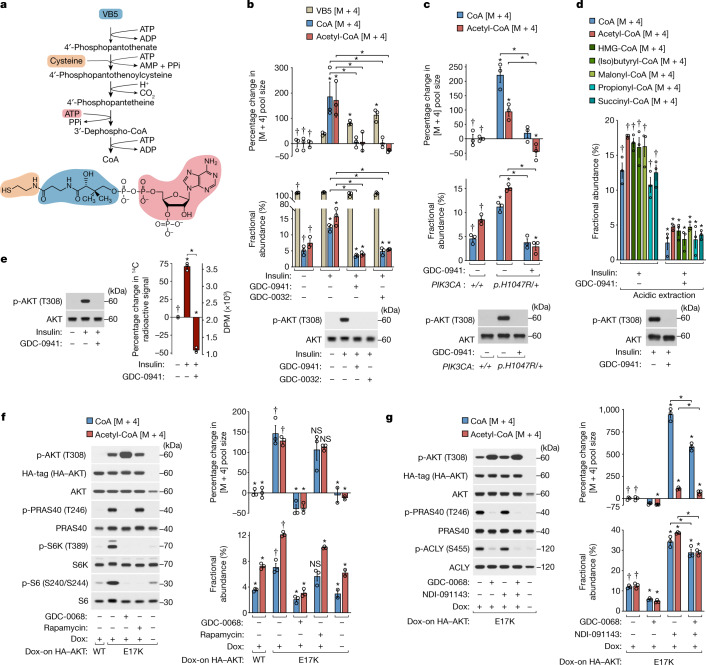
Fig. 1. PI3K–AKT signalling stimulates de novo CoA synthesis.
a, The CoA de novo synthesis pathway. b, Insulin (100 nM) and PI3K inhibitor (GDC-0941 or GDC-0032; 2 μM) treatments with concurrent 13C315N1-VB5 labelling (3 h), preceded by serum/growth factor deprivation (18 h) and inhibitor pretreatment (15 min) in MCF10A cells. c, PIK3CA+/+ and PIK3CAp.H1047R/+-knockin MCF10A cells with PI3K inhibitor (GDC-0941; 2 μM) treatment. Labelling and conditions were otherwise as described in b. d, Acid-extracted CoA and short-chain acyl-CoAs with the cells and conditions as described in b, except with 4 h treatments and labelling. e, Radioactive 14C-VB5 labelling (3 h) with the cells and conditions otherwise as described in b, followed by a chase (1 h) in medium without VB5. Disintegrations per minute (DPM) normalized to protein. f, AKT inhibitor (GDC-0068, 2 μΜ) and mTORC1 inhibitor (rapamycin, 100 nM) treatments with concurrent 13C315N1-VB5 labelling (3 h) of MCF10A cells expressing doxycycline (Dox)-inducible HA-tagged wild-type (WT) or constitutively active (E17K) AKT. Treatments and labelling were preceded by doxycycline incubation (48 h), serum and growth factor deprivation (18 h) and inhibitor pretreatment (15 min). g, AKT inhibitor (GDC-0068, 2 μΜ) and ACLY inhibitor (NDI-091143, 15 μM) treatments with the cells, labelling and conditions otherwise as described in f. For b–d, f and g, metabolites were measured using LC–MS/MS and normalized to protein; labelled metabolites (mass + 4 [M + 4]); fractional abundance is [M + 4]/total. For the percentage change graphs, the left-most treatment group mean was set to 0%. For b–g, n = 3 biological replicates (circles). Data are mean ± s.e.m. Statistical analysis was performed using one-way analysis of variance (ANOVA) with Tukey test; asterisks (*) indicate significant differences compared with the treatment groups marked with daggers (†) or between treatments indicated with brackets (P < 0.05). Immunoblotting analysis probed for total and phosphorylated (p) proteins.

