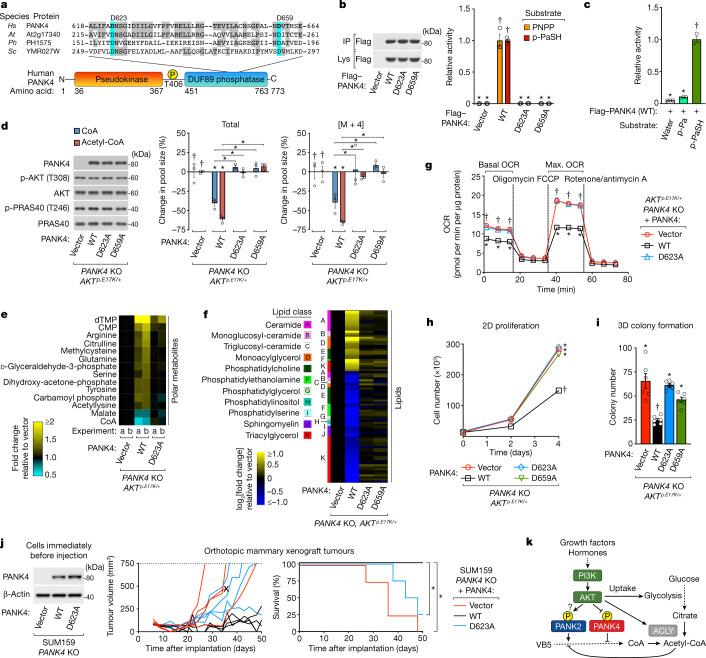
Fig. 4. PANK4 functions as a metabolite phosphatase.
a, Amino acid alignment of PANK4 with conserved catalytic aspartates (blue, bold) and other conserved residues (grey) of previously characterized DUF89 domains (non-PANK4 orthologues). At, Arabidopsis thaliana; Hs, Homo sapiens; Ph, Pyrococcus horikoshii; Sc, Saccharomyces cerevisiae. b, PANK4 phosphatase assay. Flag-tag immunopurifications from cells expressing vector or Flag–PANK4 (WT, D623A or D659A). Substrates: para-nitrophenyl phosphate (PNPP) and 4′-phosphopantetheine (p-PaSH). The wild-type mean was set to 1. c, PANK4 phosphatase assay. Flag–PANK4 as in b. Substrates: 4′-phosphopantothenate (p-Pa) and 4′-phosphopantetheine. The 4′-phosphopantetheine mean was set to 1. d, PANK4-KO AKTp.E17K/+ MCF10A cells stably expressing vector or untagged PANK4 (WT, D623A or D659A). 13C315N1-VB5 labelling (3 h) was performed with serum replacement and growth factors. Metabolites were measured using LC–MS/MS and normalized to protein. Labelled metabolites (mass + 4). Vector mean set to 0%. e, Unlabelled polar metabolomics using cells and conditions in d.Two independent experiments, ‘a’ and ‘b, were analysed (Methods). f, Unlabelled lipidomics using the cells and conditions as described in d. The analysis incorporates three independent experiments (Methods). g, Seahorse oxygen-consumption assay using the cells in d without serum or growth factors. OCR, oxygen consumption rate. h, 2D proliferation with the cells and conditions as described in d. Representative of three independent experiments. i, Three-dimensional (3D) soft agar colony formation using the cells in d with serum and growth factors. j, Orthotopic mammary xenograft tumours using SUM159 PANK4-KO cells with stable expression of vector or untagged PANK4 (WT or D623A) in nude mice. Individual tumour growth curves (left). Kaplan–Meier survival curves using tumour volume (750 mm3) or ulceration (X) end points (right). k, Model of PI3K-dependent CoA synthesis regulation. For b, d and j, immunoblotting analysis probed for total and phosphorylated proteins. For b–d and g–i, n = 3 (b–d, g and h), n = 4 (j) or n = 6 (i) biological replicates (circles). Data are mean ± s.e.m. For b–d and g–j, statistical analysis was performed using one-way ANOVA with Tukey test; asterisks (*) indicate significant differences compared with the treatment groups marked with daggers (†) or between treatments indicated with brackets (P < 0.05).

