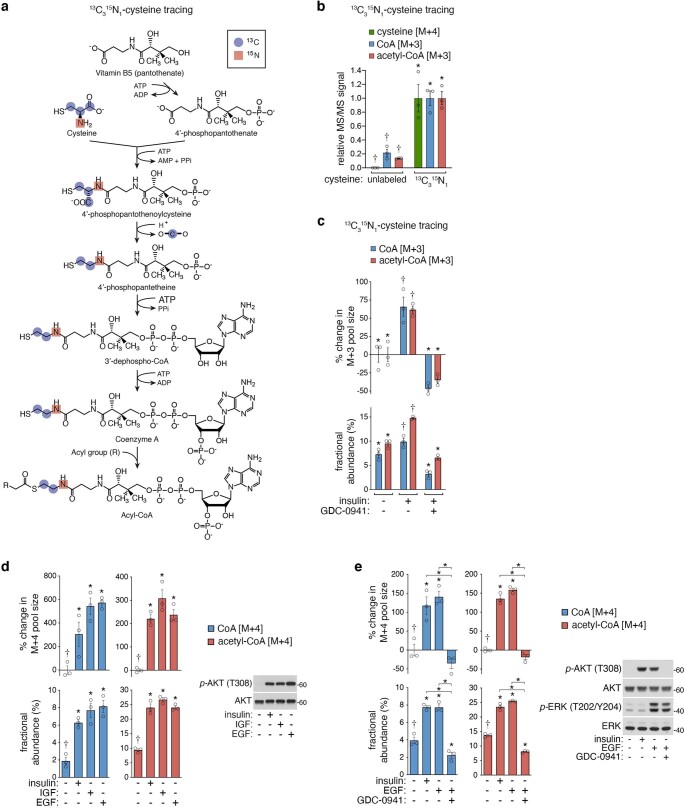
Extended Data Fig. 2. Data supporting Fig. 1.
a, Diagram of heavy isotope (13C315N1)-labelled cysteine tracing into CoA and acyl-CoAs. Labelled carbon (blue) and nitrogen (red). Note that labelled cysteine is M+4 but that labelled CoA and acyl-CoAs are M+3 due to the decarboxylation step of CoA synthesis. b, Validation of MS/MS methods for 13C315N1-cysteine tracing. Serum/growth factor-deprived (18 h) MCF10A cells were treated (3 h) with insulin (100 nM) and concurrently labelled with 13C315N1-cysteine. Graphed metabolites measured by LC-MS/MS. Replicate samples (○); mean (bars); SEM (error bars); n = 3 biological replicates. *significant difference from treatment marked (†), two-way ANOVA with Sidak’s test, (p<alpha 0.05). c, 13C315N1-cysteine tracing (3 h) with concurrent insulin (100 nM) and PI3K inhibitor (GDC-0941, 2 μM) treatments in MCF10A cells. Cells were serum/growth factor-deprived (18 h) and pretreated with inhibitor prior to tracing. Graphed metabolites measured by LC-MS/MS. Replicate samples (○); mean (bars); SEM (error bars); n = 3 biological replicates. *significant difference from treatment marked (†), one-way ANOVA with Tukey’s test, (p<alpha 0.05). d, Insulin (100 nM), Epidermal Growth Factor (EGF, 50 ng ml−1), Insulin-like growth factor 1 (IGF-1, 50 ng ml−1) treatments with concurrent 13C315N1-VB5 labelling (3 h) of serum/growth factor-deprived (18 h) MCF10A cells. Protein immunoblots probed with indicated antibodies (left); molecular weight markers in kD (right). Graphed metabolites measured by LC-MS/MS. Replicate samples (○); mean (bars); SEM (error bars). *significant difference from treatment marked (†), one-way ANOVA with Tukey’s test, (p<alpha 0.05). e, Insulin (100 nM), Epidermal Growth Factor (EGF, 50 ng ml−1), PI3K inhibitor (GDC-0941, 2 µM) treatments with concurrent 13C315N1-VB5 labelling (3 h) of serum/growth factor-deprived (18 h) MCF10A cells, pretreated with inhibitor prior to tracing. Protein immunoblots probed with indicated antibodies (left); molecular weight markers in kD (right). Graphed metabolites measured by LC-MS/MS. Replicate samples (○); mean (bars); SEM (error bars); n = 3 biological replicates. *significant difference from treatment marked (†), one-way ANOVA with Tukey’s test, (p<alpha 0.05).

