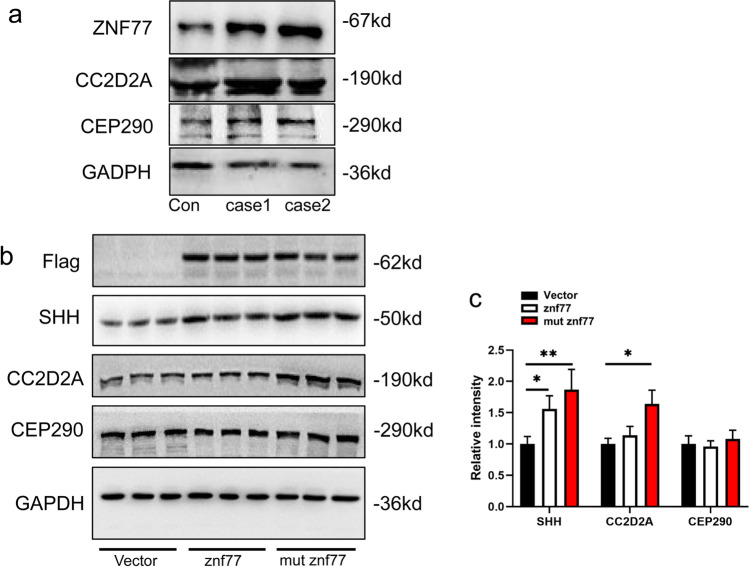
Fig.6.
Western blotting. Numbers on the right indicate molecular weight. (a) Western blot analysis of whole-brain tissue from a normal fetus and probands in case 1 and case 2. Compared with control, the density of ZNF77.CEP290 and CC2D2A appeared to decreased. (b, c) Western blot analysis of Flag-tagged ZNF77 and Flag-tagged mutated ZNF77 transfected HEK293cell cell. Lanes 1–3 demonstrate empty plasmid as control, with lanes 4–6 demonstrating ZNF77-transfected cells and lanes 7–9 mutated ZNF77-transfected. Density of the proteins is directly shown by relative intensity in histogram. Remarkable increase is noted by asterisk above cross line; the more asterisks the stronger increase. SHH has increased when ZNF77 was transfected and enhanced more significantly when mutated ZNF77. CC2D2A showed notable increased when mutated ZNF77 was transfected. CEP290 has no obvious change

