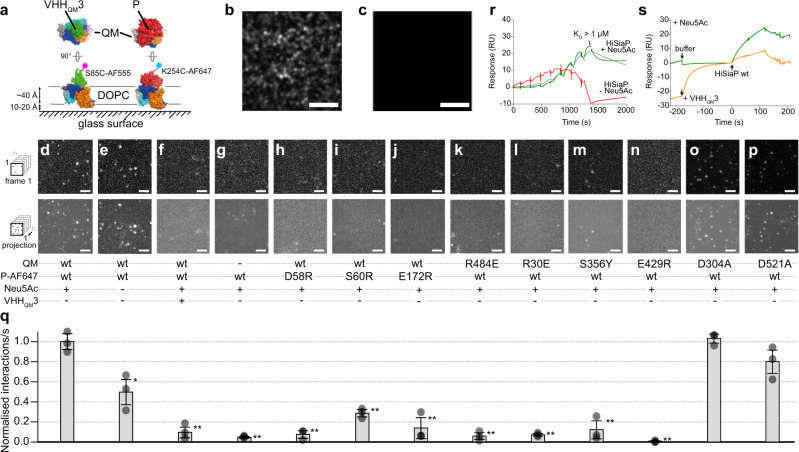
Fig. 6. Single-molecule interaction studies of HiSiaQM and HiSiaP on solid-supported bilayers (SSBs).
a HiSiaQM variants were integrated into DOPC (1,2-Dioleoyl-sn-glycero-3-phosphocholine) SSBs and their interaction with single AF-647-labelled P-domain variants or AF-555-labelled VHHQM3 was observed by TIRF microscopy. b SSB containing HiSiaQM visualised with AF-555 labelled VHHQM3. c As a control, VHHQM3-AF-555 was added to an SSB in the absence of HiSiaQM. No unspecific binding was observed. d–p Top row: first frame of an image sequence of a typical set of data. Bottom row: maximum intensity projections of the respective image sequence. The conditions are indicated below each panel. q Normalised interactions per second of P-domain variants with a SSB containing HiSiaQM variants. Unless otherwise stated, the P-domains were pre-incubated with 10 mM sialic acid (Neu5Ac). Statistical significance of the P-mutants and controls was assessed by applying a two-sided unpaired Student’s t-test with a 95% confidence interval (*p < 0.01, **p < 0.001). The full dots represent the average results of n = 3 independently prepared samples, respectively. The bars represent the mean value of the three averages. The distribution of the full dots indicates for every condition the reproducibility of the results. For each of these three samples, a fresh bilayer was prepared on a new coverslip and n = 30 individual measurements were performed. The underlying data is compiled in Supplementary Table 3. The scale bars equal 3 μm. r Sensorgrams showing the interaction of the P-domain with immobilised QM-domains (HiSiaQM K273C-biotin in DDM) in the absence (red) or presence (green) of sialic acid (5 mM). The green curve was fit with a 1:1 binding model (grey). Four independent experiments were performed. s Competition experiment between the P-domain and VHHQM3 for the immobilized QM-domains. Green curve: a buffer injection followed by an injection of the P-domain. Orange curve: the chip surface was saturated with VHHQM3 before the P-domain was added. Single experiment, supported by multiple other experiments in this study (e.g. panel (f), Fig. 3b, the cryo-EM structure). Source data are provided as a Source Data file.

