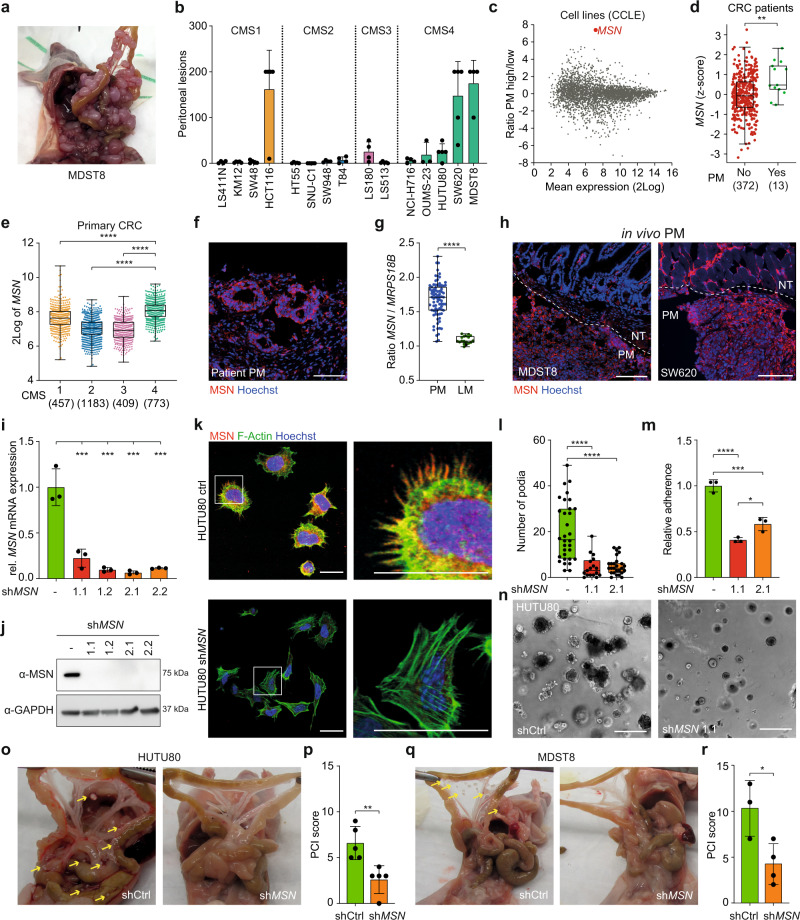
Fig. 2. Subtype-specific MSN expression is related to peritoneal metastasis.
a Peritoneal outgrowth of MDST8 cells, 10 weeks post i.p. injection. b CMS specific peritoneal outgrowth of CRC cell lines, 10 weeks post injection (mean ± S.D., n = 5 animals for all cell lines, except LS411N, SW948, T84, NCI-H716, MDST8 (n = 4 animals) and OUMS23 (n = 3 animals)). c MA-plot showing all differentially expressed genes (CCLE cell line panel) between PM high (>10 lesions/animal: HCT116, LS180, OUMS-23, HUTU-80, MDST8, SW620) vs low (≤10 lesions/animal: LS411, KM12, SW48, HT55, LS513, SW948, T84, SNU-C1, NCI-H716). d MSN expression (z-score) in primary CRCs of patients with and without PM (AMC-AJCCII-90 combined with MATCH cohort, n = 385, two-sided Mann–Whitney U test, P = 0.0034). e MSN expression (2Log) in primary CRCs22, stratified to CMS (one-way ANOVA with Tukey’s multiple comparisons test). f MSN expression in patient-derived fixed frozen peritoneal tumor material, MSN (red), nuclear staining (Hoechst, blue). Scale bars, 100 µm. g Ratio of gene expression (2Log) of MSN and housekeeping gene MRPS18B, in peritoneal metastases (PM, n = 82) and liver metastases (LM, n = 18, Kim et al.69) (unpaired, two-sided t-test, P < 0.00001). h MSN expression in MDST8 and SW620 in vivo peritoneal lesions, MSN (red), nuclear staining (Hoechst, blue), white dotted line indicates border between normal tissue (NT) and peritoneal metastasis (PM). Scale bars, 100 µm. i, j Two different sh-RNAs targeting MSN were lentivirally transduced into HUTU80 cells, single cell clones were established and MSN expression was analyzed on both mRNA (i) and protein level (j). GAPDH was used as a housekeeping gene to normalize mRNA expression (i, one-way ANOVA with Tukey’s multiple comparisons test P = 0.009, 0.0003, 0.0002, and 0.0003, respectively). k, l Confocal images (k) of either control or MSN knockdown HUTU80 cells, 24 h after seeding, MSN (red), F-Actin (green) and nuclei (Hoechst, blue). Right images are magnifications of white boxes in left images. Scale bars, 25 µm. l Number of filopodia per cell (n = 32, 17, or 26 cells/condition, for respectively control, shMSN1.1 and shMSN2.1, one-way ANOVA with Tukey’s multiple comparisons test, ****P < 0.0001). m Relative adherence of HUTU80 cells is decreased upon MSN knockdown (one-way ANOVA with Tukey’s multiple comparisons test, ****P < 0.0001, ***P = 0.0003, *P = 0.0265). n 3D matrigel outgrowth of MSN knockdown HUTU80 is impaired. Scale bars, 50 µm. o–r In vivo peritoneal tumor outgrowth is impaired by MSN knockdown for HUTU80 (o, p) and MDST8 (q, r). Representative images of tumor burden (o, q) and PCI score (p, r) of mice injected with respectively HUTU80 or MDST8 control or MSN knockdown cells, yellow arrows indicate lesions (p, n = 5 animals, r, n = 3 (control) or 4 (shMSN) animals, two-sided t-test, P = 0.0054 (p); P = 0.0274 (r)). b, i, m, p, r Bar plots represent mean and standard deviation. d, e, g, l Boxplots indicate median, first and third quartiles (Q1 and Q3), whiskers extend to the furthest values. Source data are provided as a Source data file.

