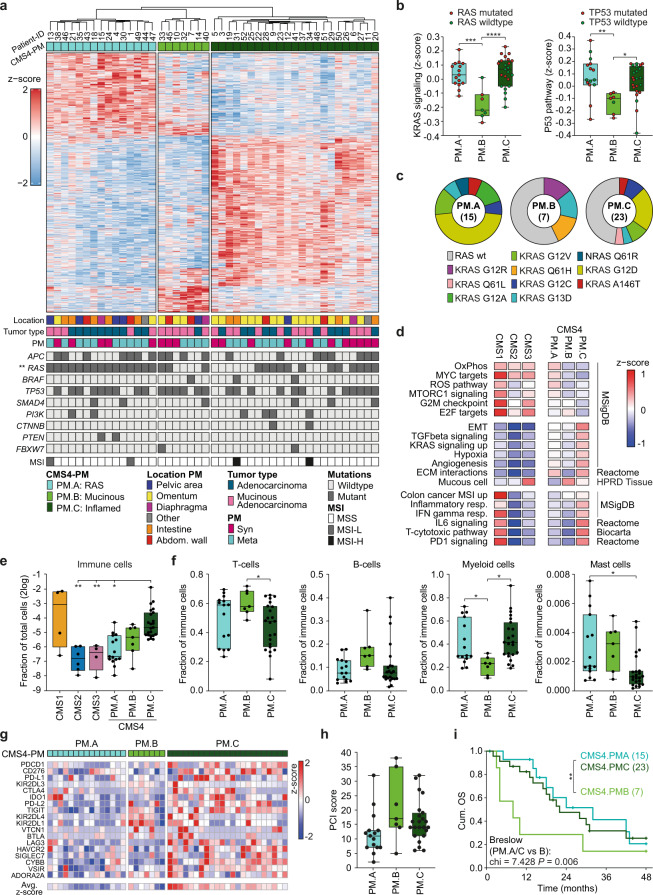
Fig. 3. Clustering CMS4 peritoneal metastases into 3 distinct subgroups.
a Heatmap depicting the 1355 most differential expressed genes between the 3 CMS4-PM subgroups (1 PM sample per patient, n = 45), clustered by CMS4-PM subgroup. Location of lesions, primary tumor type, development of PM (syn- or metachronous), mutational status of CRC driver genes and MSI are indicated below (two-sided Fisher’s exact test). b Z-scores of KRAS (left) and TP53 (right) activation gene signatures in the CMS4-PM subgroups. Red and green dots indicate respectively mutated or wild-type genes (one-way ANOVA with Tukey’s multiple comparisons test, ***P = 0.0001, ****P < 0.0001, **P = 0.0049, *P = 0.0232). c Distribution of RAS mutations (KRAS and NRAS) over the 3 CMS4-PM subtypes. d Gene set enrichment analysis depicting differentially expressed (P < 0.05, two-sided t-test) signatures between the PM subgroups. Colors indicate relative signature expression (z-score). e Deconvolution of bulk RNA sequencing data was used to determine the fraction of immune cells per sample (Welch ANOVA with Dunnett’s multiple comparisons test, P = 0.0036, P = 0.0048, and P = 0.0166). f Relative distribution of immune cell types over total immune cell compartment (one-way ANOVA with Tukey’s multiple comparisons test, T cells *P = 0.049; Myeloid cells *P = 0.0476 and P = 0.0112; Mast cells *P = 0.0142). g Heatmap depicting relative expression of 18 immune checkpoint-associated genes within CMS4-PM subgroups. h Boxplots showing PCI scores within the 3 CMS4-PM subgroups (one-way Anova, P = 0.058). i Cumulative overall survival (OS) of patients with CMS4 classified peritoneal lesions, stratified to the 3 CMS4 subgroups. CMS4-PM.B has a significantly worse survival when compared to the other two combined (Breslow, P = 0.006). b, e, f, h n = 15 (CMS4-PM.A), n = 7 (CMS4-PM.B) or n = 23 (CMS4-PM.C) biologically independent samples. a, b, e, f, i Asterisks indicate level of significance: *P < 0.05; **P < 0.01; ***P < 0.001; ****P < 0.0001. b, e, f, h Boxplots indicate median, first and third quartiles (Q1 and Q3), whiskers extend to the furthest values. Source data are provided as a Source data file.

