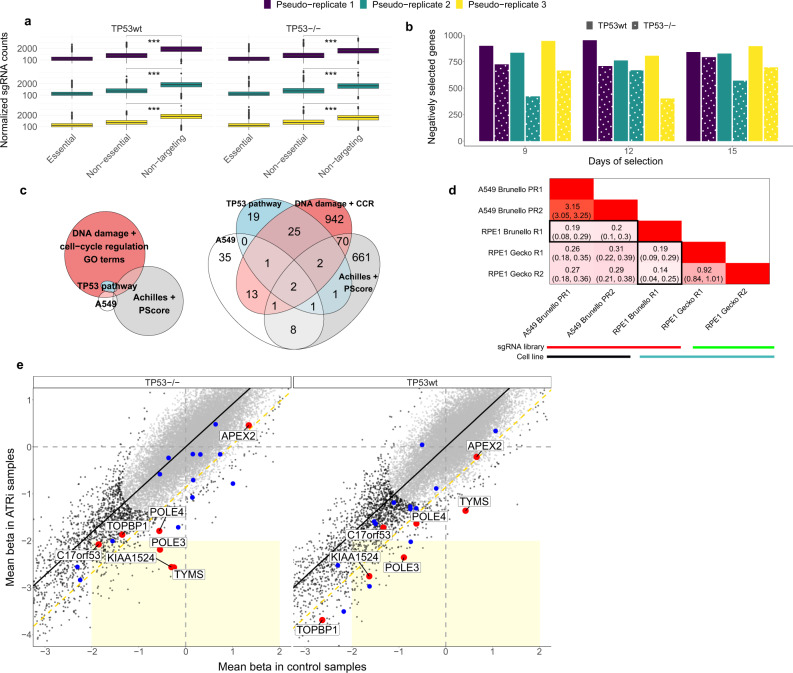
Fig. 1. A TP53 wild-type background can confound estimates of gene selection in genetic screens.
a Boxplots showing the pooled normalized sgRNA counts per sample (essential and non-essential genes, and non-targeting sgRNAs; 15 day samples are shown). Tested using 1-tailed Mann-Whitney. *** denotes a p <2.2e-16. No adjustments were made for multiple comparisons. n = 7300 independent sgRNAs examined over six independent experiments. b Barplot showing the number of genes that are negatively (beta score<0) selected, per sample used in this study. Beta score significance: FDR < 0.25. c Venn (left) and corresponding Euler (right) diagrams of the overlap of genes between four sets: genes negatively selected exclusively in TP53wt in our samples (A549), genes negatively selected exclusively in TP53wt in Project Achilles and Score (Achilles + Score), top-50 TP53-interactors (TP53 pathway), and genes included in 19 GO terms related to DNA damage and cell-cycle regulation that we found enriched with genes from the A549 set. d Results of the analysis of overlap between different cell lines and/or sgRNA libraries detailed in Supplementary Text 1a: heatmap shows the log2 odds ratio of the overlap of genes negatively selected exclusively in TP53wt, between different experiments. R: Replicate, PR: Pseudo-replicate. Darker shades of red indicate higher overlap. Black rectangles highlight the overlap between RPE1 Brunello dataset with others. e Comparison between TP53-isogenic cell lines to assess biases in identifying conditional essentiality from genetic screens. x and y axes represent the standardized beta scores (Z-scores) for genes either in the control samples (incl. doxycycline-treated; pseudo-replicates 1 and 2), or in the doxycycline+ATRi treated samples, respectively, averaged across later time points and pseudo-replicates. Coordinate axes were capped in order to zoom on the region of interest. The EM clustering identified two gene clusters as the most likely model, represented by black and gray dots. Black line represents the best fit linear model. The yellow dashed diagonal line represents −2 standard deviations (SD) of the Z-score difference. The light yellow rectangle delimits the tentative significance area containing genes negatively selected in the treatment, but not selected in the control sample (i.e., potentially synthetic lethal with ATRi). The top-20 validated ATRi-sensitizing genes are highlighted with color, and the top-7 (red) are further labelled. Source data are provided as a Source Data file.

