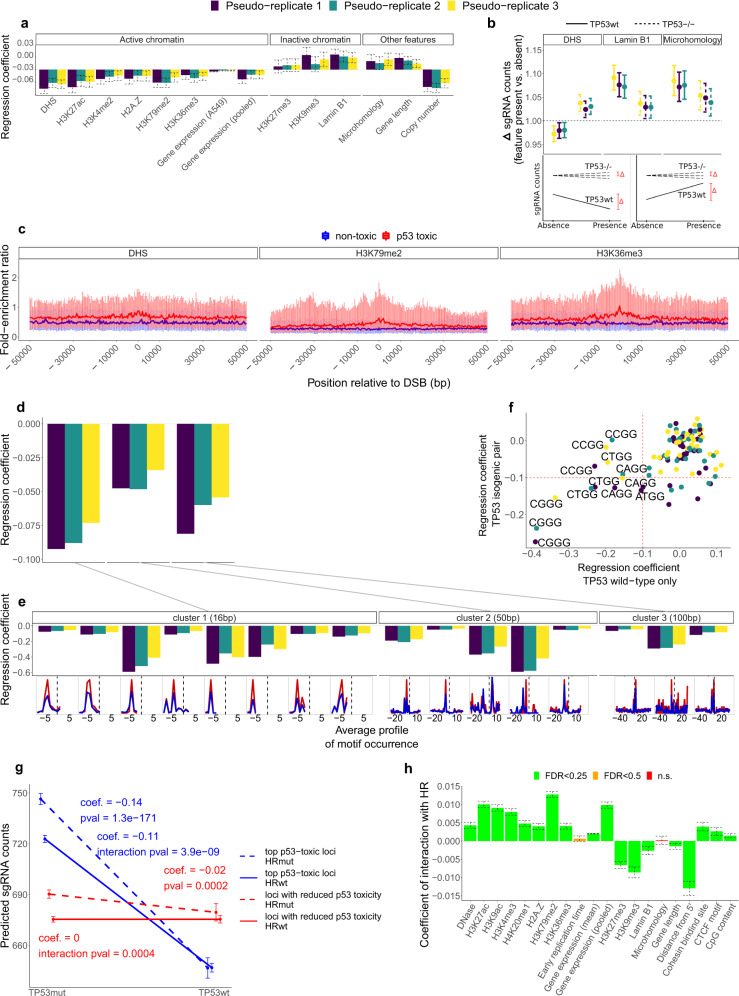
Fig. 2. Association of active chromatin marks with high-p53-toxicity sgRNA target sites.
a NB regression coefficients for each chromatin feature tested independently. Each colour represents one of the three pseudo-replicates. The regression coefficients are those from the interaction of TP53 status with a given variable (see Supplementary Fig. 6a (bottom) for the effect of each variable per se, including only the TP53wt samples). Negative regression coefficients indicate a decrease of sgRNA counts. All regression coefficients have FDR < 0.25. n = 10,050 independent sgRNAs and 14 chromatin features were examined over six independent samples at three time points. Error bars represent the SE of the mean. b Interpretation of the regression coefficients of the interactions between TP53 status and three selected features. There is a larger departure of the fitted sgRNA counts if the feature is present (its absence is scaled to 1) in TP53wt samples. For active chromatin feature DHS, the departure happens towards lower sgRNA counts in TP53wt samples (i.e., more p53 toxicity vinculated to presence of the feature), while the opposite is true for Lamin B1 (inactive chromatin) and microhomology. Error bars are 95% CI. Pseudo-replicates follow the same color scheme as in Fig. 1a. Schematics are included to aid interpretation of DHS (bottom left) and Lamin B1 and Microhomology (bottom right); the actual regressions are in Supplementary Fig. 6c. n = 10,050 independent sgRNAs and three chromatin features examined over six independent experiments. c Local abundance of a feature (represented as the ChipSeq fold-enrichment ratio), averaged at each 400bp-bin position relative to the sgRNA cut position (denoted 0), shown for the top 200 target loci exhibiting high p53 toxicity (larger negative LFC, red) and top 200 non-selected loci (LFC closer to 0, blue). Vertical lines represent the 25–75% interquartile range at each bin, and left-to-right lines connect the medians. Supplementary Fig. 6d shows the corresponding figures when using another score. d Clusters of DNA sequence motifs identified by HOMER as enriched near target loci (FDR < 1e-5) —at different genomic distance to the sgRNA cut position— that show a significant (FDR < 0.25; red crosses indicate FDR > 0.25) and consistent association with higher p53 toxicity in the NB regressions (see Supplementary Fig. 8 for the effect of each variable alone regressed against the same sgRNA set, including only the TP53wt samples). e Separate regression results for motifs contained in the motif clusters. Below each motif are shown its relative frequencies at target (red) and background (blue) loci. The actual motif sequences are shown in Supplementary Fig. 8B. f Associations with all PAM sequence contexts, as regression coefficients. Top associations with DSB-related p53 toxicity are labelled. See Supplementary Fig. 9 for additional information. g Interaction of TP53 and HR repair gene mutational status, using either the counts from the target loci (blue) or from the control loci (red). For the regressions including only HRmut cell lines (dashed lines) the regression coefficient and associated p-value are shown; for the regressions including only HRwt cell lines (full lines) the regression coefficient and p-value of the interaction of TP53 and HR are shown. Error bars represent the 95% CI. n = 16,174 independent sgRNAs examined over 124 independent cell lines. h Regression coefficients of the interaction between each feature and the HR repair mutational status. Positive coefficients indicate that the increment of DSB toxicity when a feature is present (or more abundant) is alleviated in HRwt cells. Error bars represent the SE of the mean. FDR adjustment was performed to account for multiple comparisons. n = 56,855 independent sgRNAs and 20 chromatin features examined over 124 independent cell lines. Source data are provided as a Source Data file.

