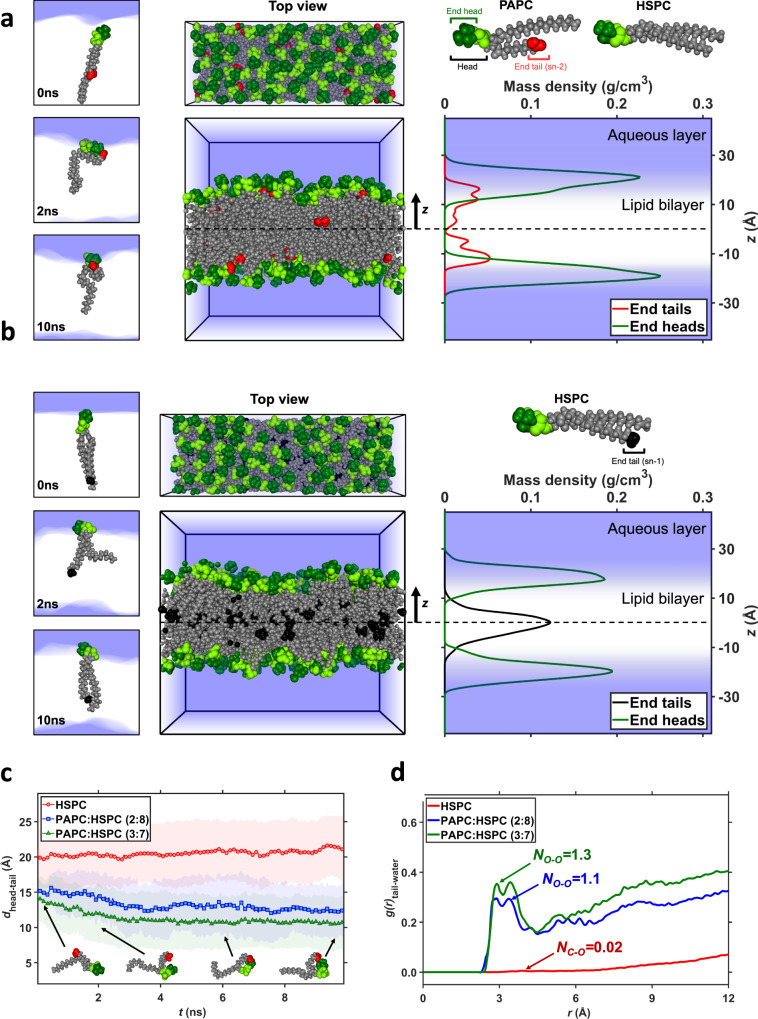
Fig. 3. Computational simulation showing the “tail-flipping” phenomenon of PAPC in the bilayer of nanoliposomes.
Top and side views of a PAPC:HSPC (3:7) and b pure HSPC bilayers at the end of 10 ns molecular dynamics (MD) simulations, along with the mass density profiles of the tops of all lipid heads and sn-2 tail ends of PAPC or sn-1 of HSPC. Atoms in head groups are highlighted in dark green, the oxygen atoms at the end of the sn-2 tails are colored in red, and the carbon atoms at the end of the sn-1 tails are colored in black. Their densities distributions along the bilayer normal are colored likewise. The blue zones depict aqueous regions. On the left side, snapshots of a a PAPC and b an HSPC lipid at the three times indicated, illustrating the markedly different locations of the tail ends of the two lipids. c The intra-molecular distance between the centers of mass of the head’s top and the sn-2 tail’s end of PAPC in two mixed bilayers, and the sn-1 tail’s end of HSPC in a pure bilayer, plotted against simulation time. Average distances are represented by markers, standard deviations by the shaded areas. The simulations started with straightened tails; the tails with carboxylated ends subsequently folded to bring the oxygen atoms near the head group, while the all-carbon tails remained elongated. The snapshots show conformations of a PAPC lipid at the times and distances indicated by the arrow heads. d Radial distribution functions g(r) of water oxygen atoms relative to the two oxygen (carbon) atoms at the end of the sn-2 (sn-1) tail of PAPC (HSPC) in mixed (pure) bilayers, averaged over the last 1 ns of the simulation. Next to the curves are the average numbers NO–O and NC–O of contacts of per tail atom with oxygen atoms of water molecules in the first neighbor shell, i.e., contacts corresponding to the nearest-neighbor peak ending at 4.2 Å.

