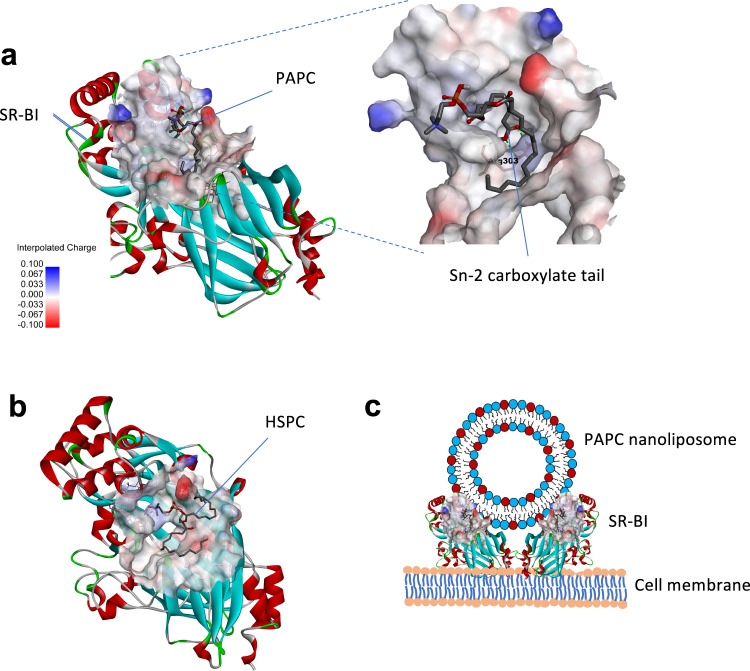
Fig. 4. Molecular docking analysis for binding of PAPC and HSPC with SR-B1 receptor.
a Docking image showing binding of PAPC with SR-B1 structure obtained using Autodock software. The SR-B1 structure show cationic sites (light blue color) which forms a pocket for the interaction with PAPC. The carboxylated sn-2 tail forms hydrogen-bonds with Arg303 as shown in the enlarged image. b Image shows the interaction of HSPC with SR-B1 in which tails are not showing any contact with the receptor. c The illustration showing the potential interaction of PAPC-L with SR-B1 receptor on the cell membrane of the macrophage.

