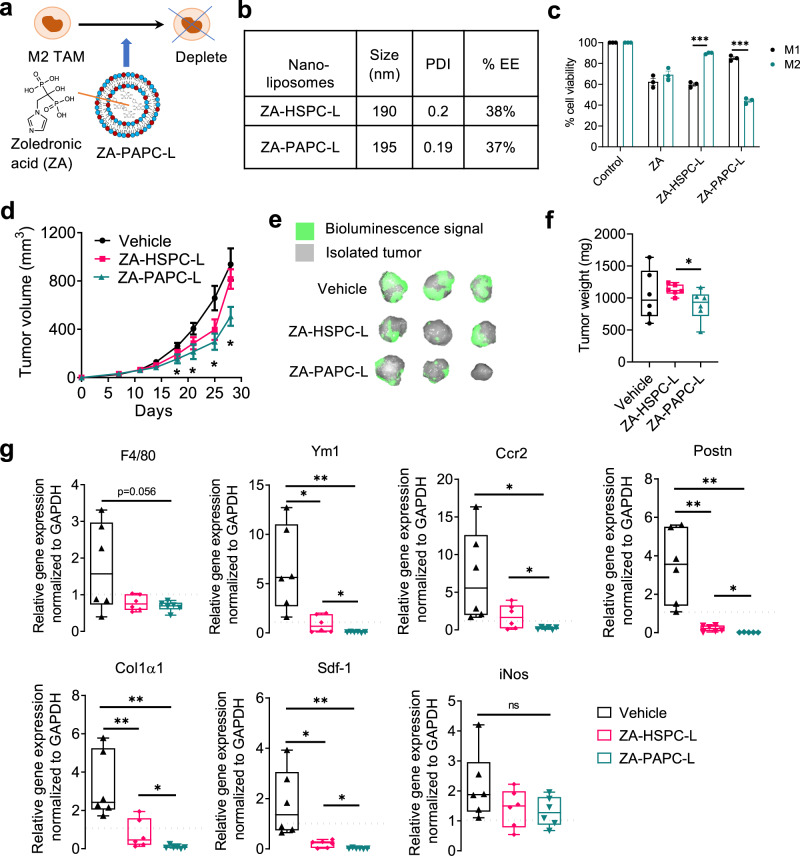
Fig. 7. Targeting zoledronic acid (ZA) using PAPC-L.
a A diagram showing ZA encapsulated PAPC nanoliposomes (ZA-PAPC-L) depleting M2 TAMs. b Physicochemical properties of AS-HSPC-L and AS-PAPC-L and encapsulation efficiency (%EE). c % cell viability of THP-1 differentiated M1 and M2 macrophages 24 h after the treatment of free ZA, ZA-HSPC-L or ZA-PAPC-L (left to right: ***p = 0.000043, ***p = 0.000049). Data represents mean ± standard error of the mean (SEM) for three independent experiments. Statistical analysis was performed with Multiple unpaired t-tests with correction for multiple comparisons using the Holm–Sidak’s method. d Tumor growth curves in orthotopic 4T1 breast tumor model in mice. Both ZA-HSPC-L and ZA-PAPC-L were injected with dose equivalent to 0.5 mg/kg ZA, 100 µl injection volume, i.v., twice a week, when tumors became ±100 mm3. Before sacrifice, mice were injected with 2.5 mg of D-luciferin and were imaged after 10 min to detect bioluminescence signal using Pearl Trilogy imager (LICOR) (left to right: *p = 0.049, *p = 0.034, *p = 0.014, *p = 0.018 between Vehicle and ZA-PAPC-L). Mean + SEM, N = 6 mice per group, Statistical analysis was performed with unpaired two-tailed Student’s t-test. e Representative images showing the isolated tumors with bioluminescence signal (green). f Graphs showing the tumor weight of the isolated tumors at the end of the experiment. N = 6 mice per group (*p = 0.043). Statistical analysis was performed with unpaired two-tailed Student’s t-test. g Box graphs showing quantitative real-time PCR results showing the effect of ZA-HSPC-L and ZA-PAPC-L on different markers for pre-metastatic niche in lungs. N = 6 mice per group (left to right, Ym1: *p = 0.010, **p = 0.0043, *p = 0.044; Ccr2: *p = 0.018, *p = 0.042; Postn: **p = 0.0020, **p = 0.0031, *p = 0.021; Col1α1: **p = 0.0088, **p = 0.0011, *p = 0.048; Sdf-1: *p = 0.014, **p = 0.0079, *p = 0.012; iNos: ns = non-significant). Data in (f and g) represent the box-and-whisker plot in which every dot represents a data point and the line in the box as median; the box shows the upper to the lower quartiles; the whiskers show the minimum to the maximum value. Statistical analysis was performed with unpaired two-tailed Student’s t-test. Source data are provided as a Source Data file.

