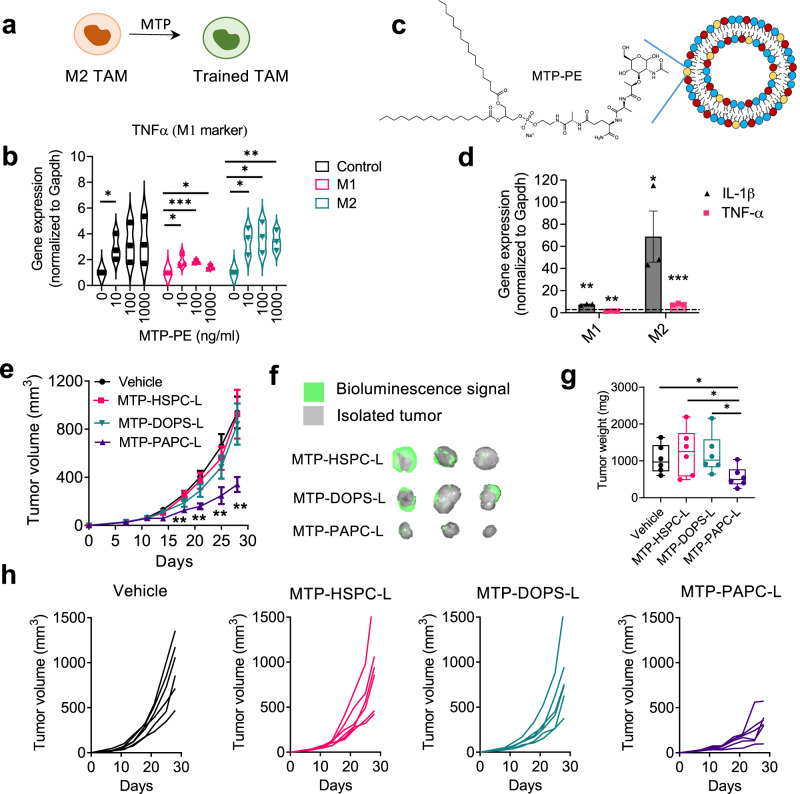
Fig. 8. Training TAMs by targeting muramyl tripeptide (MTP)-PE using PAPC-L.
a A diagram showing the role of MTP in training M2 TAMs into M1 macrophages. b Gene expression data showing that treatment of RAW264.7 macrophages with MTP-PE leads to the induction of TNF-α as well as of IL-1β (see Supplementary Fig. 11)(left to right, Control: *p = 0.030; M1: *p = 0.032, ***p = 0.00037, *p = 0.010; M2: *p = 0.0150, *p = 0.016, **p = 0.0058). Data represented as Violin plot for three independent experiments. Statistical analysis was performed with Multiple unpaired t-tests with correction for multiple comparisons using the Holm–Sidak’s method. c MTP-encapsulated PAPC nanoliposomes (MTP-PAPC-L) incorporating MTP-PE in the lipid bilayer. d Gene expression data showing that treatment with MTP-PAPC-L induced the expression of M1 markers (IL-1β and TNF-α) in M2 macrophages to a much higher extent than in M1 macrophages (left to right: **p = 0.00013, **p = 0.0099, *p = 0.042, ***p = 0.00019). Data represents mean ± standard error of the mean (SEM) for three independent experiments. Statistical analysis was performed with Multiple unpaired t-tests with correction for multiple comparisons using the Holm-Sidak’s method. e Tumor growth curves showing the effect on the tumor growth in 4T1 breast tumor model in mice. Dose of MTP-PE equivalent to 1 mg/kg/mouse, 100 µl intravenous, twice a week. (left to right: **p = 0.0027, **p = 0.0011, **p = 0.0075, **p = 0.0022 between Vehicle and MTP-PAPC-L). Mean + SEM., N = 6 mice per group, Statistical analysis was performed with unpaired two-tailed Student’s t-test. f Representative images showing the isolated tumors with bioluminescence signal (green). The vehicle group was the same as shown in Fig. 7 as experiments were run in parallel. g Box graph showing the tumor weight of the isolated tumors at the end of the experiment (left to right: *p = 0.030, *p = 0.039, *p = 0.029). N = 6 mice/group. Data represent the box-and-whisker plot in which every dot represents a data point and the line in the box as median; the box shows the upper to the lower quartiles; the whiskers show the minimum to the maximum value. Statistical differences were determined by unpaired two-tailed Student’s t-test. h Curves showing the tumor growth of individual tumor in different treatment groups. Source data are provided as a Source Data file.

