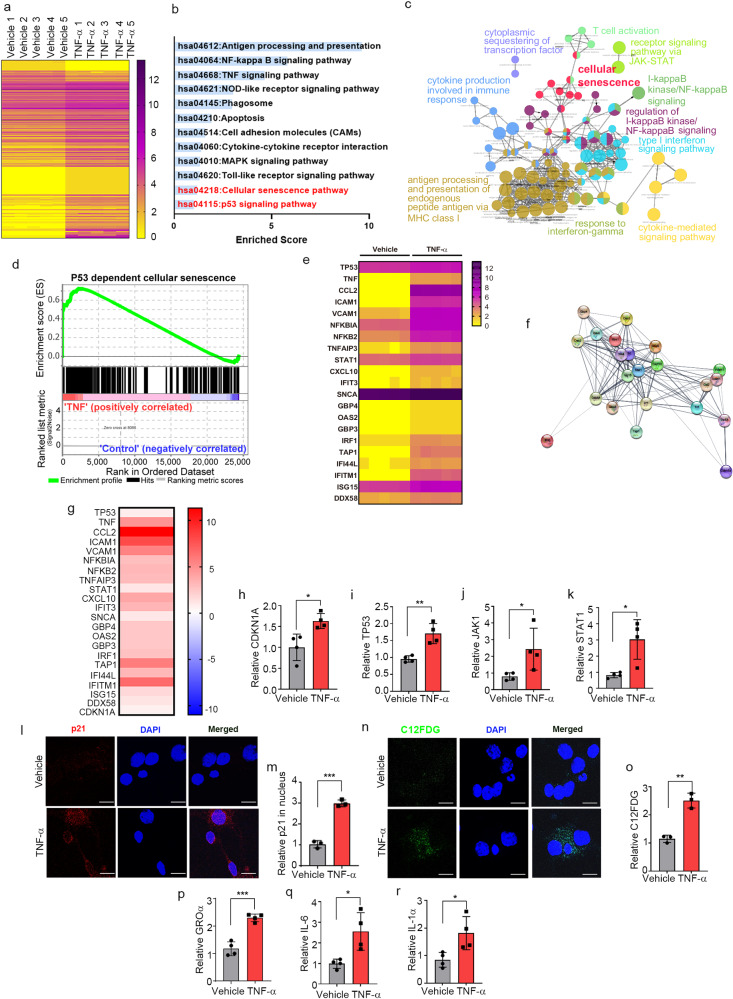
Fig. 3. TNF-α induces neuronal senescence.
a Heatmap representing the expression levels (log2 read count number) of DEGs with upregulated (fold change >1.3) or downregulated (fold change <0.7) expression after treatment with TNF-α or vehicle (n = 5 per group). b The top 12 enriched KEGG terms for the 118 DEGs in the TNF-α-treated neurons. c Simplified networks of significantly enriched GO terms. Each term is statistically significant (Benjamini–Hochberg correction <0.05). The nodes (colored circles) display significantly enriched parent GO terms; the edges show the overlapping genes between terms; and the size of the node represents the number of enriched genes. d Enrichment plot of DEGs in the TNF-α-treated versus vehicle-treated neurons (FDR q-value <0.005). e Heatmap of the expression levels of 22 DEGs related to the JAK-STAT senescence pathway. f High confidence protein–protein interaction network of the 22 DEGs related to the JAK-STAT senescence pathway, constructed using STRING. g Heatmap of the log2-fold changes of the 22 DEGs related to the JAK-STAT senescence pathway. h–k Expression of CDKN1A (h), TP53 (i), JAK1 (j), and STAT1 (k), measured by RT-qPCR. l Immunofluorescence analysis of p21 protein in primary neurons treated with TNF-α or vehicle. m Quantification of relative p21 fluorescence in the nucleus. n C12FDG staining representing the accumulation of SA-β-gal. Nuclei were stained with DAPI (blue). o Quantification of C12FDG levels. p–r SASP genes GROα (p), IL-6 (q), and IL-1α (r), measured by RT-qPCR. All data are presented as the mean ± SEM (*P < 0.05, **P < 0.005, ***P < 0.0005). Statistical significance was determined by two-tailed unpaired Student’s t test (h–k, m, o, p–r).

