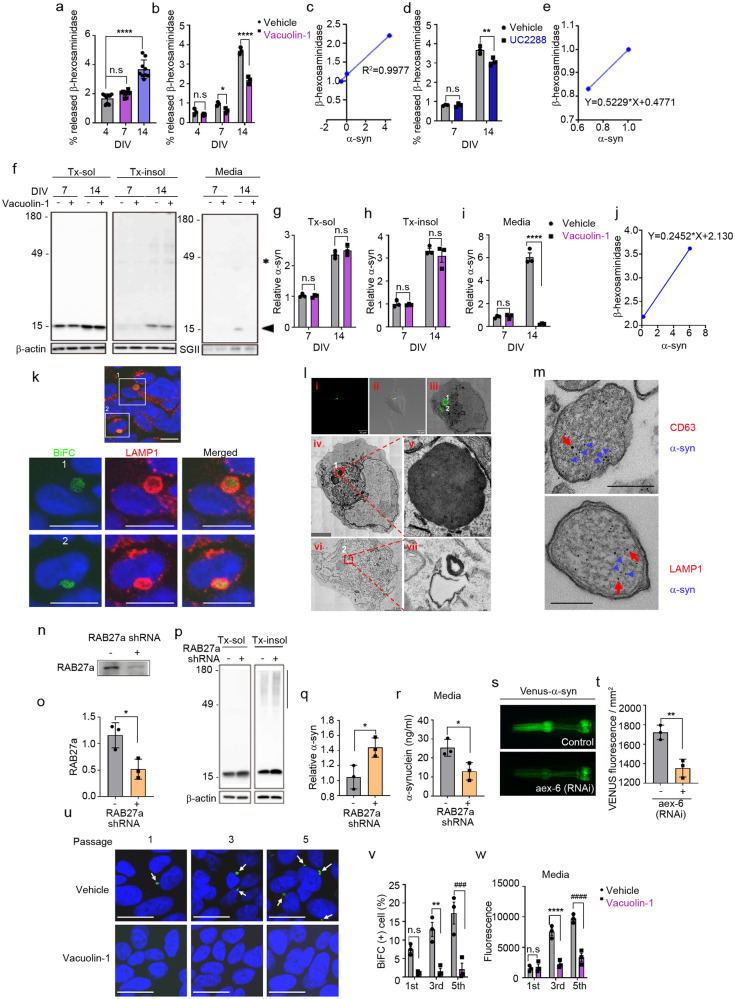
Fig. 5. Senescence-associated secretion of α-synuclein is regulated by lysosomal exocytosis.
a Levels of secreted β-hexosaminidase during neuronal senescence (n = 9). b Effects of vacuolin-1 on the senescence-induced secretion of β-hexosaminidase (n = 3). c Correlation between α-synuclein and β-hexosaminidase secretion during senescence (n = 3). d Effects of UC2288 (p21 inhibitor) on senescence-induced secretion of β-hexosaminidase (n = 3). e Correlation between α-synuclein and β-hexosaminidase secretion in the presence or absence of UC2288 (n = 3). f–i Inhibition of lysosomal exocytosis reduced senescence-induced secretion of α-synuclein. f Representative western blot images of α-synuclein in the Triton X-100-soluble (Tx-sol) fraction, Triton X-100-insoluble (Tx-insol) fraction, and culture media (Media). The arrowhead indicates the quantified synuclein. Asterisks indicate nonspecific antibody binding. Quantification of α-synuclein in Tx-sol (g), Tx-insol (h), and media (i). j Correlation between α-synuclein and β-hexosaminidase secretion in the presence or absence of vacuolein-1 (n = 3). k Subcellular localization of α-synuclein. Green, BiFC-positive α-synuclein aggregates; red, LAMP1; blue, nuclei. Scale bar: 20 μm. Lower panels 1 & 2: magnification of areas bounded by squares in upper panels. l CLEM analysis of BiFC-positive structures. Lower panels iv & vi: magnifications of the two BiFC puncta (1 and 2) in Panels i, ii & iii, respectively. Scale bar: 4 μm. Panels v & vii: magnifications of BiFC puncta 1 and 2. m Immunoelectron microscopy analysis of α-synuclein-positive lysosome-like structures. Blue arrowheads indicate α-synuclein; red arrows indicate CD63 (upper panel) and LAMP1 (lower panel). Scale bar: 200 nm. n–r Effects of RAB27a knockdown on α-synuclein secretion. n, o RAB27a knockdown efficiency. Quantification of RAB 27a in (o) (n = 3). p Representative western blot images of α-synuclein in the Tx-sol and Tx-insol fractions. The bar on the right side of the blot indicates the quantified area in the Tx-insol fraction. q Quantification of α-synuclein in the Tx-insol fraction (n = 3). r Quantification of α-synuclein in culture media by ELISAs (n = 3). s, t Effect of RNAi-mediated RAB27a knockdown on α-synuclein propagation in C. elegans. s Venus fluorescence in the pharynx, representing the extent of cell-to-cell propagation of α-synuclein in this C. elegans model. Quantification of Venus fluorescence at Day 2. More than fifty worms for each line were analyzed (n = 3). u–w Effects of vacuolin-1 on α-synuclein propagation. u Representative images of BiFC in passages 1, 3, and 5 in the presence or absence of vacuolin-1. Arrows indicate BiFC puncta. Scale bar: 20 μm. v Quantification of the BiFC-positive cells in (u) (n = 3; minimum 1000 cells per experiment). w Quantification of BiFC fluorescence (secreted α-synuclein) in culture media (n = 3). The levels of α-synuclein and RAB27a in cell extracts were normalized to those of β-actin, and the levels of proteins in media were normalized to those of secretogranin II (SGII). All data are presented as the mean ± SEM (*P < 0.05, **P < 0.005 ***P < 0.0005, ###P < 0.0005, ****P < 0.0001, ####P < 0.0001). Statistical significance was determined by one-way ANOVA with Dunnett’s post hoc comparison between groups (a), two-way ANOVA with Tukey’s post hoc comparison between groups (b, d, g–i, v, w), or two-tailed unpaired Student’s t test (o, q, r, t).

