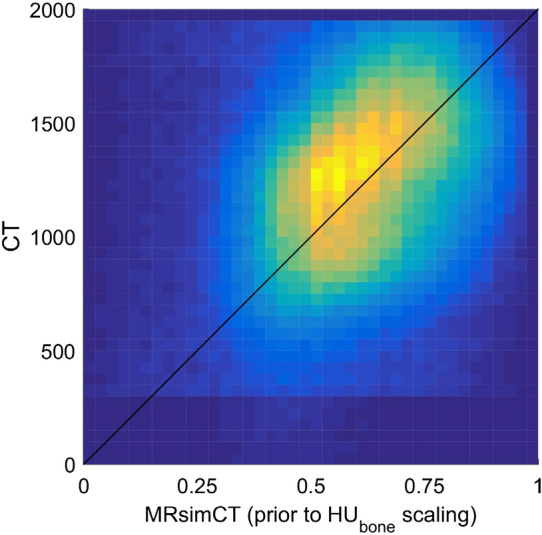
Figure 2.

Relationship between CT and MRsimCT values. MRsimCT values prior to HUbone scaling in (2) span a range from 0 to 1 and can be used as an estimate for bone fraction. For the CT parameters used in this study, pure bone was calculated to have a value of 2000 HU36. The black line depicts the nominal relationship between CT and MRsimCT values. Because only three ex vivo skulls were used in this study, using a linear regression to predict CT HU from MRsimCT values may overfit to the data. Therefore, the nominal linear relationship was used to predict CT HU instead.
