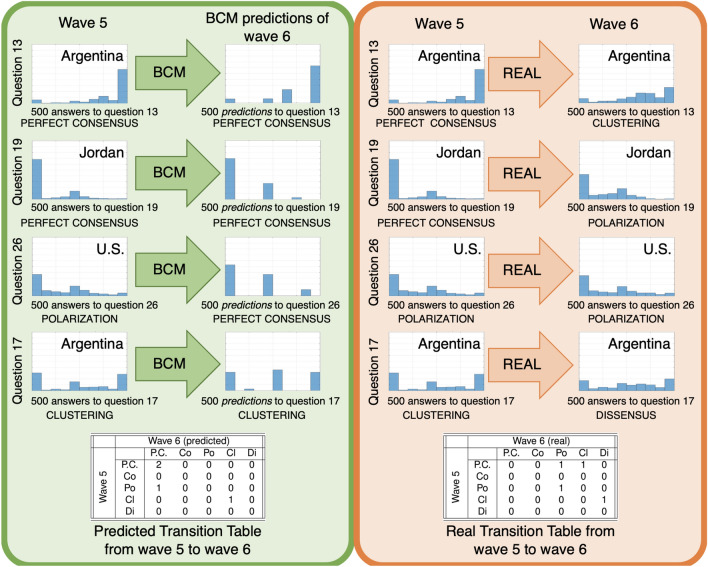
Figure 2.
Simple example to illustrate the proposed approach: based on the answers to 4 questions administered to 500 people in two consecutive survey waves, the accuracy of the Bounded Confidence Model (BCM) can be assessed by comparing the predicted transition table (left) with the real transition table (right). In the tables P.C. is perfect consensus, Co is consensus, Po is polarization, Cl is clustering, and Di is dissensus. This example is simply aimed at showcasing how the approach works, so any model could have been chosen; the BCM was selected because it is a widely used, well-known and well-studied model.

