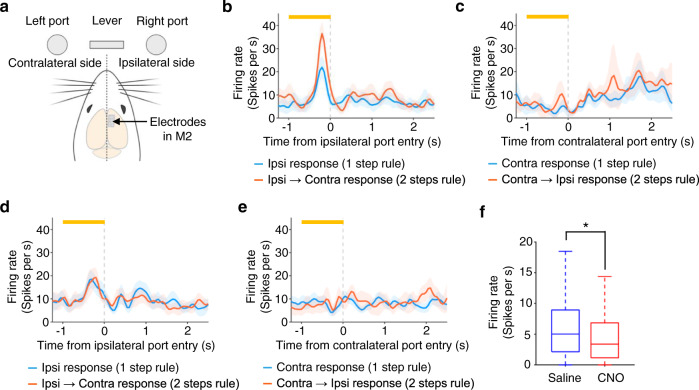
Fig. 5. Chemogenetic silencing of ACC decreased firing rate during pre-choice period in M2 neurons.
a Ipsilateral and contralateral sides viewed from a rat’s cerebral hemisphere in which M2 single-unit activity was measured. Rats were implanted with Utah array electrodes in M2 of either left or right hemisphere and neural activity was measured during their task performance with IP injections of saline or CNO solutions (20 mg/kg). In the following analysis, trials were classified according to which side port (ipsilateral or contralateral) rats chose as their 1st choices. b Peri-event time histogram (PETH) of a representative single-unit showing rule selective responses before making a correct response to the side port that was located on the ipsilateral side of neural activity measurements (ipsilateral condition). In 1 step condition (blue line), the rat made a choice of the ipsilateral port while, in 2 steps condition (red line), the rat made its 1st choice of the ipsilateral port and then made its 2nd choice of the contralateral port. Only trials in Rule Switch-blocks were used for constructing the PETH. Orange bar at the top, a 1-s period immediately before rat’s entry to the ipsilateral port (pre-choice period). The center of the band, mean. c Same as in b, but PETH was calculated using trials in which the rat made a correct response to the side port that was located on the contralateral side of neural activity measurements (contralateral condition). d PETH of a single-unit measured in a session in which the rat received an IP injection of CNO solution. e Same as in d, but for contralateral condition. f Population result of firing rate during the pre-choice period (all the correct trials in 1 step and 2 steps conditions were combined). Box-and-whisker plots indicate the minimum, 25th, 50th, 75th percentiles, and maximum excluding outliers (i.e., 1.5 times greater than the interquartile range). *P = 4.8 × 10⁻⁷; Mann–Whitney test (two-sided; n = 594 and n = 306 single-units for saline and CNO conditions, respectively). Shaded bands, 95% confidence intervals (b–e). Source data are provided as a Source Data file.

