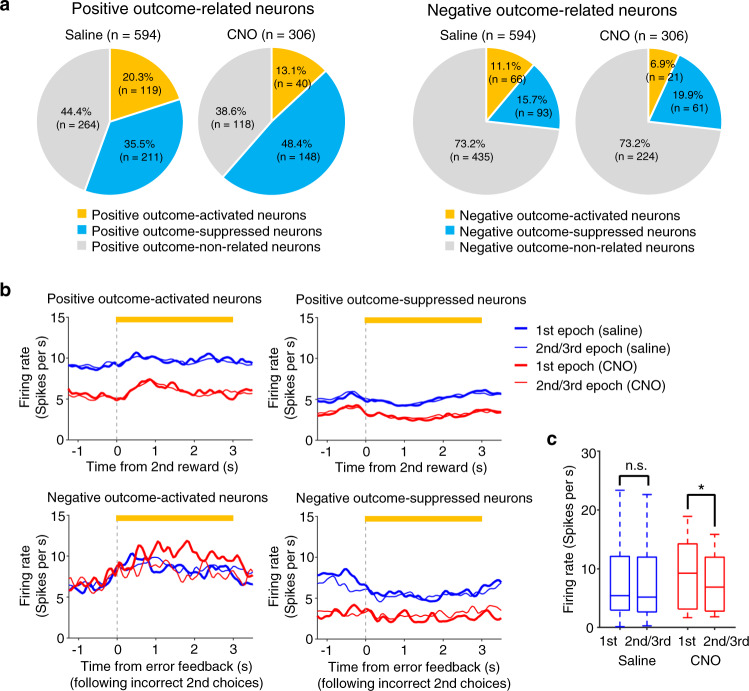
Fig. 7. Chemogenetic silencing of ACC increased firing rate of negative outcome-encoding M2 neurons upon rule switches.
a Each M2 neuron (n = 594 neurons and 306 neurons for saline and CNO conditions, respectively) was classified based on its activity during the outcome feedback period, i.e., positive outcome-activated neurons, positive outcome-suppressed neurons, negative outcome-activated neurons, and positive negative-suppressed neurons (see Methods for details). The proportion of positive outcome-activated neurons was smaller in CNO condition than in saline condition (13.1% vs 20.3%, χ2 = 6.73, P = 0.009) while that of positive outcome-suppressed neurons was greater in CNO condition than in saline condition (48.4% vs 35.5%, χ2 = 13.9, P = 0.00019). Similarly, the proportion of negative outcome-activated neurons was smaller in CNO condition than in saline condition (6.9% vs 11.1%, χ2 = 4.17, P = 0.041) while that of negative outcome-suppressed neurons was smaller in CNO condition than in saline condition but was not statistically significant (19.9% vs 15.7%, χ2 = 2.61, P = 0.106). b Population-averaged PETHs of positive outcome-activated neurons (top left, n = 66), positive outcome-suppressed neurons (top right, n = 66), negative outcome-activated neurons (bottom left, n = 19), negative outcome-suppressed neurons (bottom right, n = 21). Red, CNO (IP, 20 mg/kg). Blue, saline. Thick and thin lines represent 1st and 2nd/3rd epochs in 2 steps condition, respectively. c Mean firing rate of each negative outcome-activated neuron was calculated for a 3 s period starting from the onset of error feedback tone presentation in incorrect 2nd choice trials, and was compared between 1st and 2nd/3rd epochs in Rule Switch-blocks of 2 steps condition. A significant difference was found between 1st and 2nd/3rd epochs in CNO condition (n = 19 neurons; median, 9.23 spikes s−1 vs 6.86 spikes s−1; *P = 0.018, two-sided signed rank test) while no difference was found in saline condition (n = 66 neurons; median, 5.41 spikes s−1 vs 5.17 spikes s−1; n.s., P = 0.53, two-sided signed rank test). Box-and-whisker plots indicate the minimum, 25th, 50th, 75th percentiles, and maximum. Source data are provided as a Source Data file.

