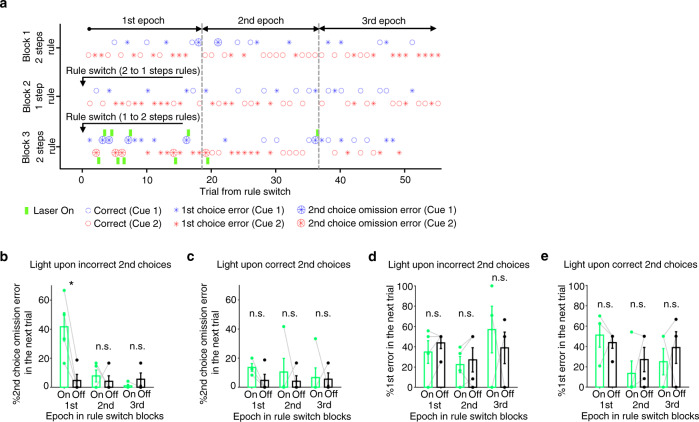
Fig. 9. Optogenetic silencing of ACC neurons upon incorrect 2nd choices induced sequential choice errors in the immediately subsequent trials that followed rule switches.
a Task performance chart of a representative session in which light was delivered upon incorrect 2nd choices in Rule Switch-block. Green bar, light delivery. Small circle, correct trial. Asterisk, 1st choice error. Large circle filled with an asterisk, 2nd choice omission error. Blue and red represent two distinct tone cues. Gray dotted lines show borders separating three epochs in each block (1–18th, 19–36th, and 37–55 trials for 1st, 2nd and 3rd epochs, respectively). b 2nd choice performance was plotted for trials that immediately followed a 2nd choice omission error trial. On and Off represent trials in which light was delivered and not delivered, respectively. The performance was plotted for each of the three epochs separately. *P = 0.0201 for 1st epoch, P = 0.575 and 0.391 for 2nd and 3rd epochs, respectively (two-sided two samples t-test, n = 4 rats). Error bar, SEM. c Light was delivered for 4 s after correct 2nd choices instead of incorrect 2nd choices (see Fig. 8d). 2nd choice performance was plotted for trials that immediately followed a 2nd choice omission error trial. P = 0.544, 0.780 and 0.641 for each epoch, respectively. Two samples t-test (two-sided), n = 4 rats. Error bar, SEM. d Same as in b, but 1st choice performance was plotted for trials that immediately followed a 2nd choice omission error trial in which a light was delivered upon incorrect 2nd choices (On condition) or not delivered (Off condition). P = 0.212, 0.598 and 0.913 for each epoch, respectively. Two samples t-test (two-sided), n = 5 rats. Error bar, SEM. e Same as in c, but 1st choice performance was plotted for trials that immediately followed a 2nd choice omission error trial in which light was delivered upon correct 2nd choices (On condition) or not delivered (Off condition). P = 0.640, 0.503 and 0.587 for each epoch, respectively. Two samples t-test (two-sided), n = 5 rats. Error bar, SEM. Source data are provided as a Source Data file.

