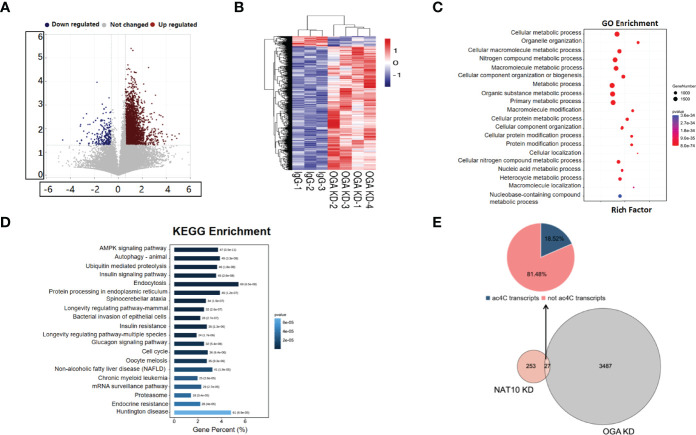
Figure 5.
Expression Profiling of Oocytes with OGA Knockdown. (A) Volcano map showed global genes change after OGA KD, with blue dots representing downregulation and red dots representing upregulation. (B) Heatmap showed the overall clusters of differential expression of genes. (C) A total of 3,514 DEGs with OGA KD were mainly associated with metabolic processes according to GO enrichment. (D) KEGG analysis displayed top 20 pathways where 3,514 DEGs were involved in. (E) Pie chart showed the distribution of DEGs by joint analysis of OGA KD, NAT10-KD transcriptomes, and ac4C RIP data.

