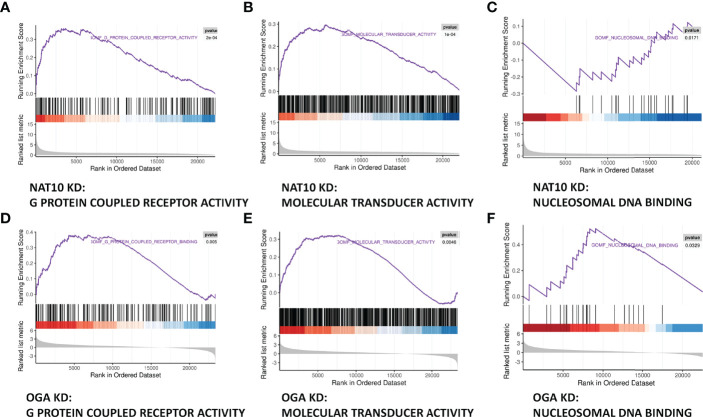
Figure 6.
Joint Analysis of NAT10-depleted and OGA-depleted Transcriptomes. (A–C) GSEA analysis showed that NAT10 KD transcriptome genes were mainly enriched in G protein–coupled receptor activity, molecular transducer activity, and nucleosomal DNA binding. (D–F) OGA-depleted expression profiling was enriched in similar gene sets as NAT10-KD according to GSEA analysis.

