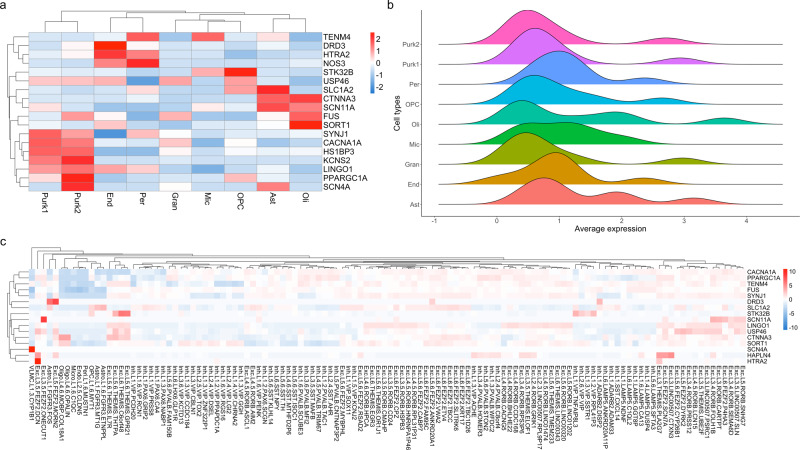
Fig. 4. Single-cell enrichment of ET genes in cerebellar and cortical tissues.
a Single-cell enrichment Z-score heatmap of ET-related genes in adult cerebellar tissue. Rows represent ET genes; columns represent cell types of the cerebellum (Purk1 SORC3+ Purkinje cells, Purk2 SORC3− Purkinje cells, Ast Astrocytes, OPC Oligodendrocyte progenitor cells, Oli Oligodendrocytes, Mic Microglia, End Endocytes, Gran Granule cells, Per Pericytes). b Ridge plots displaying distribution of average expression counts of ET-related genes in different cell types of the adult cerebellum. c Z-score expression heatmap of ET genes in single-cell types of the adult cortex. Rows represent ET genes; columns represent cortical cell types (Exc Excitatory, Inh Inhibitory, Astro Astrocytes, End Endocytes, Peri Pericytes, VLMC vascular and leptomeningeal cells, OPC Oligodencrocyte progenitor cells, Oligo Oligodendrocytes, L# cortical layer).

