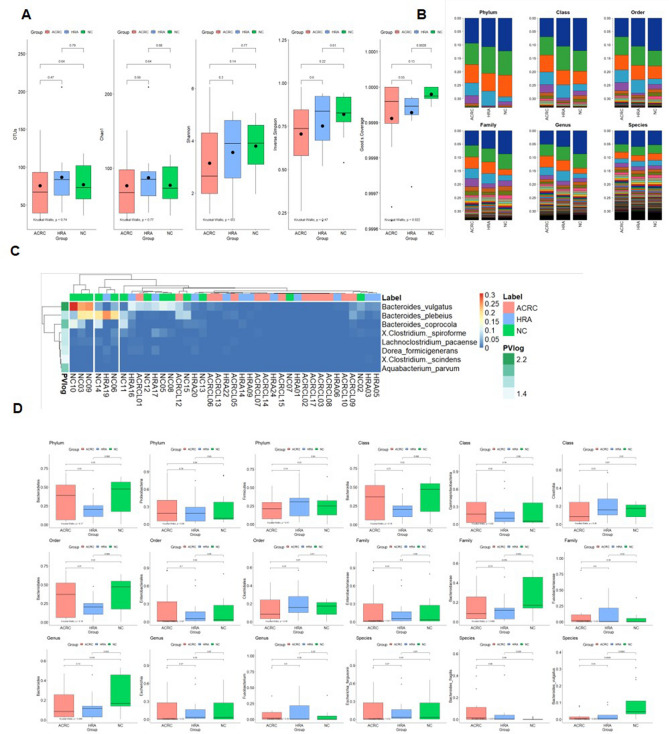
Figure 2.
Alpha diversity, distribution, and different patterns of the metagenome analysis. (A) Five diversity indices were visualized as boxplots. Points and horizon bars indicate the means and the medians of each group, respectively. The operational taxonomic unit (OTU), the Chao1, the Shannon index, the inverse Simpson index, and the Good’s coverage are provided. The three groups are advanced colorectal cancer (ACRC; n = 13), high-risk adenoma (HRA; n = 10), and normal controls (NC; n = 7). (B) Relative abundance of each classification level. The relative abundance of each sample is listed by phylum, class, order, family, genus, and species. (C) Heatmap showing the relative abundance of significantly different bacterial species between the three groups. Of 528 species, 8 were significantly different between the three groups (ANOVA, p < 0.05). Each row indicates 8 species and is classified by group. Statistical significance is indicated as a row annotation bar, and darker green indicates greater significance. Each column represents an individual patient, and their labels are indicated as a column annotation bar. Each cell of the heatmap indicates the relative abundance of species, with colors gradually changing from blue to red, corresponding to low and high relative abundance, respectively. (D) Boxplots showing the ratio of the abundance in each group of the top three taxa in six classification levels. In each boxplot analysis, the statistical significance of the three pairings (ACRC vs. NC, ACRC vs. HRA, and HRA vs. NC) was analyzed by t-test, the overall significance was analyzed by Kruskal–Wallis test, and the p-value is presented. ANOVA analysis of variance.

