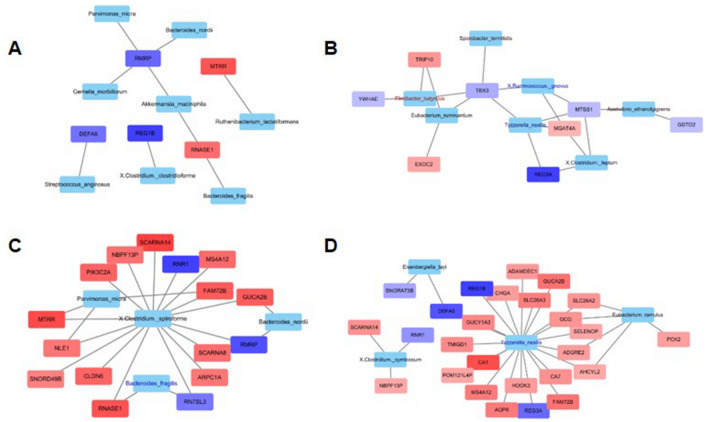
Figure 4.
Interaction networks between differentially expressed genes (DEGs) and relative abundance of microbial strains. (A) Network analysis of 13 advanced colorectal cancer (ACRC) samples and 10 high-risk adenoma (HRA) samples versus 7 normal control (NC) samples. (B) Network analysis of 13 ACRC samples versus 10 HRA samples. (C) Network analysis of 13 ACRC samples versus 7 NC samples. (D) Network analysis of 10 HRA samples and 7 NC samples. Genes that are enriched in the word group are indicated in red; all other genes are in blue. Species with high relative abundance in the word group are indicated in red; all other species are in blue.

