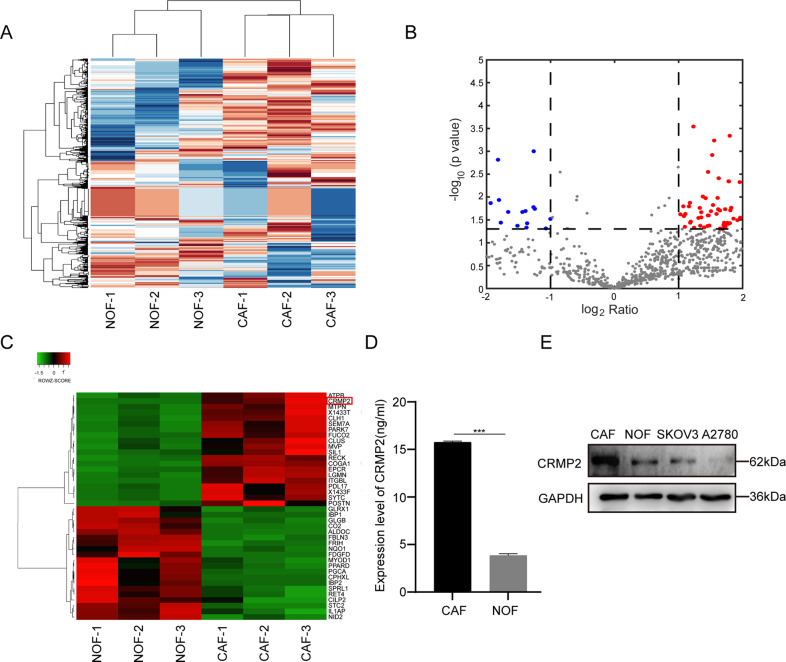
Fig. 2. Differential expressed proteins were characterized from CAF-CM and NOF-CM.
A Mass spectrum analysis of significant differential proteins in the supernatant of CAFs and NOFs. B Volcano plot depicted 95 differential proteins which were abundant in CAFs (red spots, log2 ratio > 2, P < 0.05). The bule spots represented the down-regulated proteins. C The top 20 significantly differentiated proteins were listed in the heatmap. CRMP2 (DPYL2, DPYSL2) was marked with a red square frame. D ELISA assay detected the expression of CRMP2 in the supernatant of CAFs and NOFs. E Western blotting analyzed the expression of CRMP2 in CAFs, NOFs, SKOV3, and A2780 cells. Results are presented as the mean ± SD of three independent experiments. ***P < 0.001.

