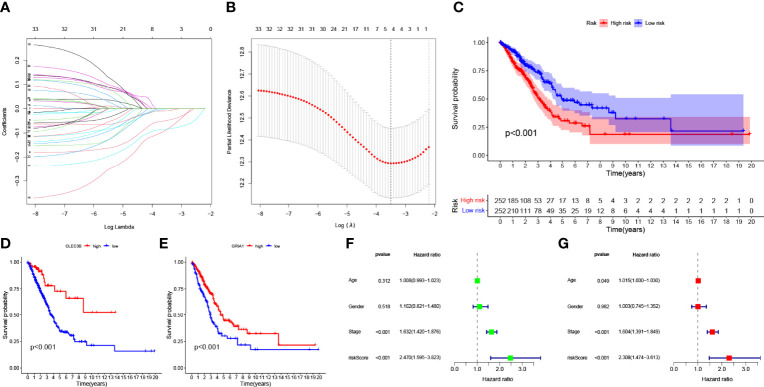
Figure 3.
(A) Variation curve of the regression coefficient with Log (λ) in Lasso regression. (B) Ten-fold cross-validation for tuning parameter selection in lasso regression. Vertical lines are drawn from the best data according to the minimum criterion and 1 standard error criterion. (C) Kaplan–Meier curve analysis showing the difference in overall survival between high-risk and low-risk groups in TCGA-LUAD cohort. Kaplan–Meier curve analysis showed the difference in overall survival of the CLEC3B (D) gene and GRIA1 (E) gene between the high expression group and low expression group. (F) Univariate Cox regression results for overall survival. (G) Multivariate Cox regression results for overall survival.

