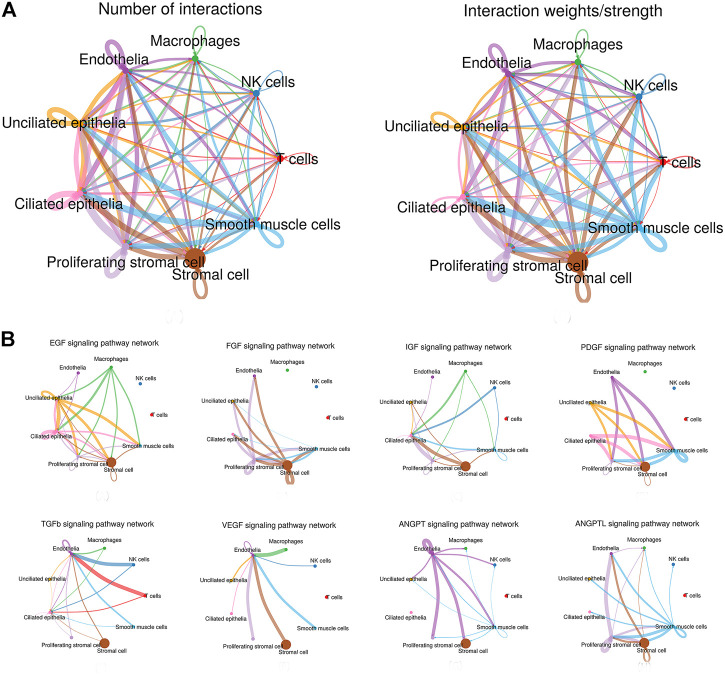
FIGURE 2.
Interaction plot of endometrial cells and intercellular communication networks for spatially colocalized endometrial cell populations. (A) Interaction net count plot of endometrial cells. The interaction weight plot of endometrial cells. The thicker the line represented, the more the number of interactions, and the stronger the interaction weights/strength between the two cell types. (B) Intercellular communication networks for spatially colocalized endometrial cell populations. The circle plot showed the inferred intercellular communication network for proliferation and angiogenesis-related signaling pathways. The thicker the line represented, the more the number of interactions, and the stronger the interaction weights/strength between the two cell types.

