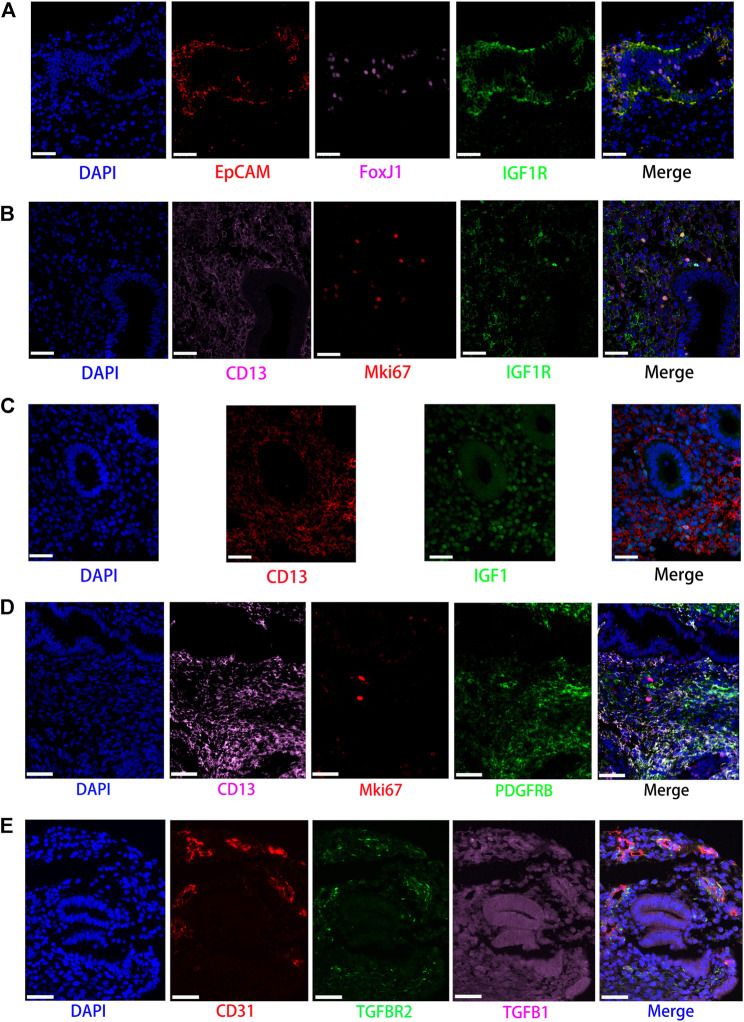
FIGURE 6.
Partly ligand and receptor immunofluorescence staining of the IGF, PDGF, as well as TGFb signaling pathway. (A) Co-staining of EpCAM (epithelial cell, red) with FoxJ1 (Cilia, pink), IGF1R (green), and nucleus (blue) by immunofluorescence. (B) Co-staining of CD13 (stromal cell, pink) with Mki67 (red), IGF1R (green), and nucleus (blue) by immunofluorescence. (C) Co-staining of CD13 (stromal cell, red) with IGF1 (green) and nucleus (blue) by immunofluorescence. (D) Co-staining of CD13 (stromal cells, pink) with MKI67 (red), PDGFRB (green), and nucleus (blue) by immunofluorescence. (E) Co-staining of CD31 (endothelial cell, red) with TGFBR2 (green), TGFB1 (pink), as well as nucleus (blue) by immunofluorescence. (Scale bars = 50 μm).

