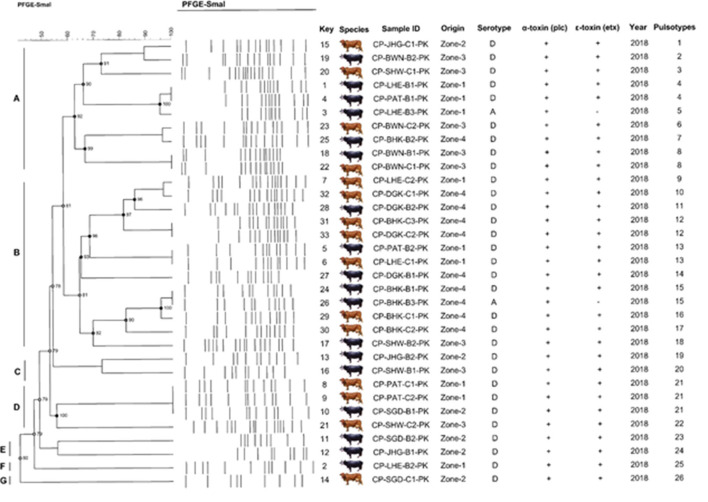
Figure 7.
Schematic representation (genetic profile, key species, isolate, serotype, toxinotypes, and pulsotypes) of 33 C. perfringens isolates obtained from buffalo and cattle in Pakistan. The macro-restriction pattern was conducted with SmaI. Dendogram obtained using BioNumerics 7.6 software and unweighted pair group method with Arithmetic mean. Letters (A–G) represents the C. perfringens toxinotypes prevalent in bovines.

