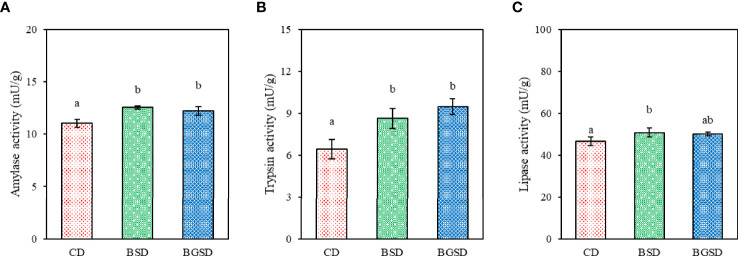
Figure 1.
Comparison of the measured amylase (A), trypsin (B), and lipase (C) activities between the three groups. The data represent the mean ± standard deviation; different letters indicate statistically significant differences between groups (P < 0.05). Control diet, CD: without Bacillus sp. PM8313 or β-glucan, BSD: 1 × 10⁸ CFU g−1 Bacillus sp. PM8313, and BGSD: BSD + 0.1% β-glucan.

