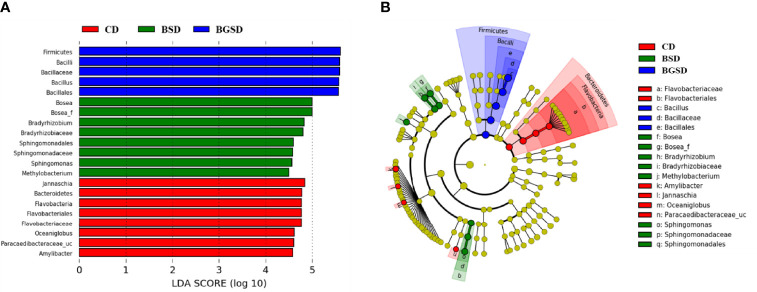
Figure 5.
Linear discriminant analysis effect size (LEfSe) analysis of the differential abundance of taxa within red sea bream intestinal microbiota following random sampling from each group. (A) Linear discriminant analysis (LDA) score of the abundance of different taxa; (B) cladogram showing differentially abundant taxa among the three groups from phylum to genus. Control diet, CD: without Bacillus sp. PM8313 or β-glucan, BSD: 1 × 10⁸ CFU g−1 Bacillus sp. PM8313, and BGSD: BSD + 0.1% β-glucan.

