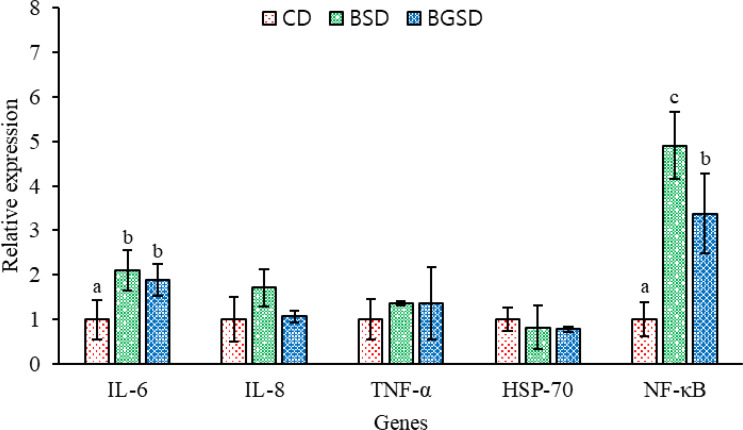
Figure 7.
Profiles of immune-related gene expression in the intestine of red sea bream. The expression of these genes was measured in the CD, BSD, and BGSD groups by RT-qPCR after 8 weeks of feeding. The gene expression levels were quantified relative to β-actin transcription. The data are represented as the means ± standard deviation; different letters indicate significant differences between groups (P < 0.05). Control diet, CD: without Bacillus sp. PM8313 or β-glucan, BSD: 1 × 10⁸ CFU g−1 Bacillus sp. PM8313, and BGSD: BSD + 0.1% β-glucan.

