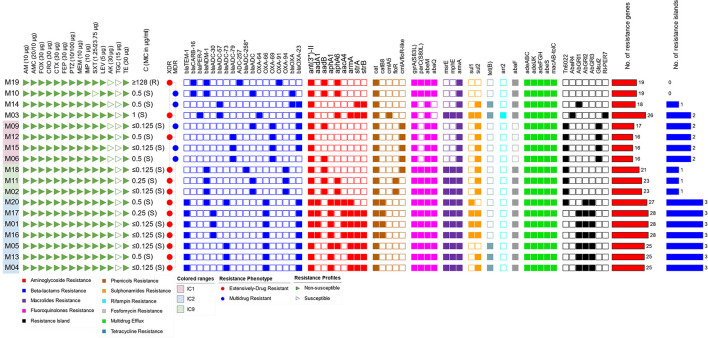
Figure 2.
Overview of the antimicrobial susceptibility profiles and resistance determinants. The isolates were ordered according to their SNP-based phylogenetic relationship. Labels of GC1 isolates (together with their phylogenetically related isolates) are highlighted in pink and those of GC2 and GC9 are highlighted in blue and green, respectively. The map is divided into panels corresponding to susceptibility to antimicrobial agents (triangular icons), resistance phenotypes (circular icons), resistance determinants (square icons), and the number of resistance determinants and islands (bars). AM, ampicillin; AMC, amoxicillin/clavulanic acid; FOX, cefoxitin; CRO, ceftriaxone; CTX, cefotaxime; FEP, cefepime; PTZ, piperacillin/tazobactam; MEM, meropenem; IMP, imipenem; SXT, sulfamethoxazole/trimethoprim; LEV, levofloxacin; AK, amikacin; TGC, tigecycline; TE, tetracycline; C, colistin; XDR, extensive drug resistance; MDR, multidrug resistance.

