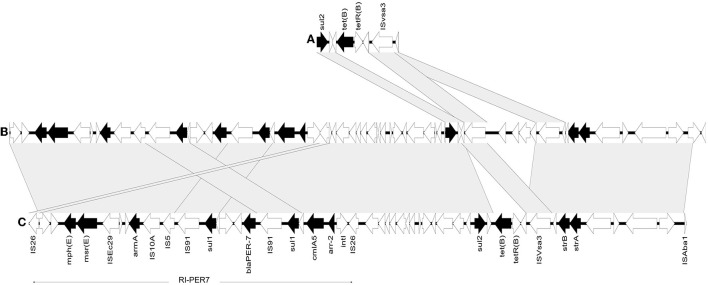
Figure 3.
Comparative genomic analysis of the partial sequence of M03 plasmid and the closely similar plasmid pPM194229_1(CP050433.1). (A) pPM194229_1 plasmid sequence region [218446-224334 bp]. (B) pPM194229_1 plasmid sequence region [1-50187 bp]. (C) M03 plasmid partial sequence. Arrows correspond to open reading frames, and black ones denote resistance genes. Gray shadings highlight regions of 99% or more nucleotide identity.

