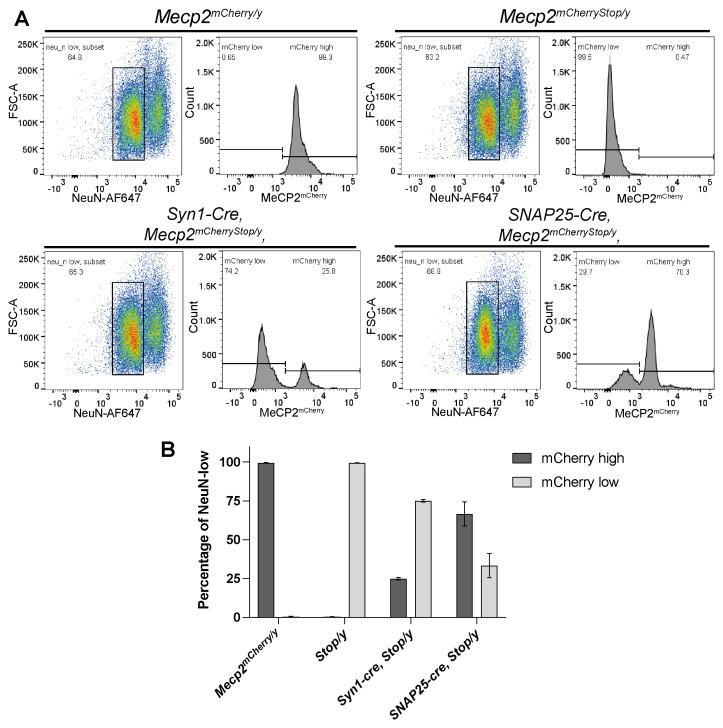
Figure 5. Flow cytometry analysis revealed substantial amounts of Cre recombination in both Snap25-IRES2-cre and Syn1-cre NeuN-low brain nuclei.
A) Flow cytometry analysis of nuclei extracted from Mecp2 mCherry/y, Mecp2 mCherryStop/y (Stop/y), Syn1-Cre,Mecp2 mCherryStop/y , Snap25-IRES2-Cre,Mecp2 mCherryStop/y ( Snap25-cre,Mecp2 mCherryStop/y ) brains. Shown here are representative plots for each genotype showing the gating strategy used to identify the proportion of NeuN-low neuronal nuclei which have activated MeCP2 mCherry expression by flow cytometry. Intact, single nuclei (gating strategy shown in the Supplementary figure 1) were gated and analysed for their NeuN expression (plot 1: y axis: Forward Scatter FCS-A; x axis: NeuN-APC647 fluorescence). The NeuN-low populations were then gated and analysed for MeCP2 mCherry expression (plot 2: y axis: nuclei count; x axis: mCherry/PE-Texas Red fluorescence.) B) Bar charts showing the proportion of NeuN-low nuclei which are within the MeCP2 mCherry-high (dark grey) or MeCP2 mCherry-low (light grey) gate for three biological replicates of each genotype. Plotted is the mean and standard deviation.

