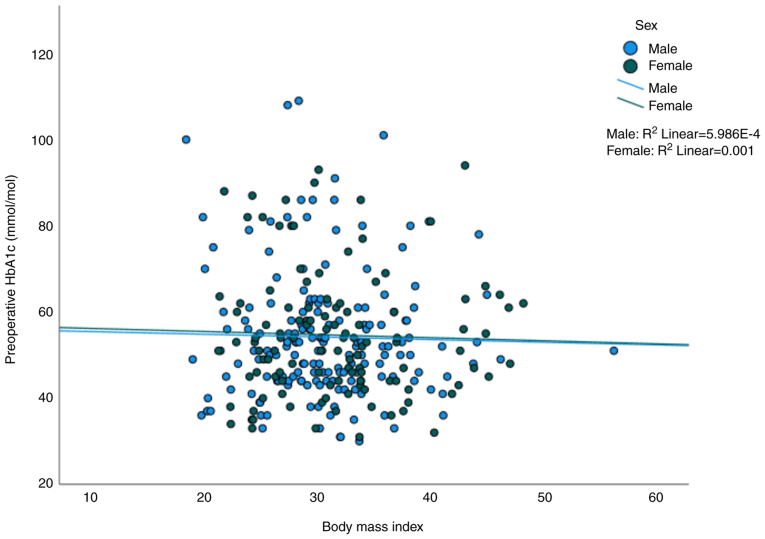
Figure 2.
Scatter plot of body mass index vs. preoperative HbA1C level (mmol/mol). The blue dots represent males and green dots represent females with corresponding best fit line for both sexes. Pearson's correlation analysis performed using SPSS Statistics software showed r=−0.24 (P=0.751) for males and r=−0.32 (P=0.736) for females. HbA1C, glycated haemoglobin.

