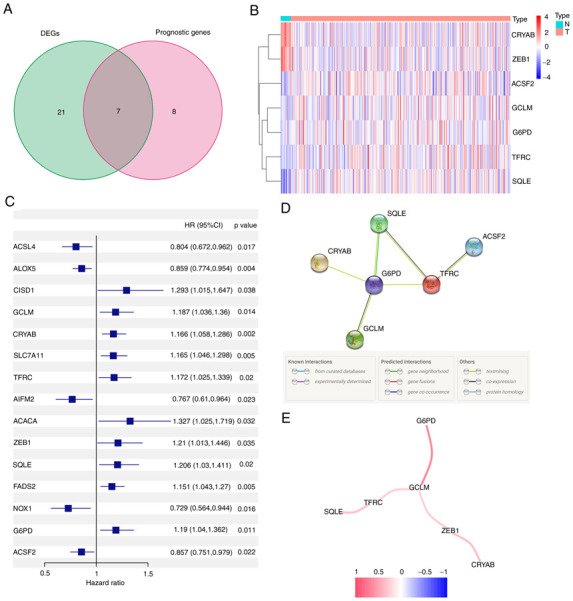
Figure 2.

Identification of the candidate FRGs in The Cancer Genome Atlas cohort. (A) Venn diagram of DEGs. (B) Heat map of DEGs between tumor and adjacent non-tumor patient tissues. (C) Forest plot demonstrating the results of a univariate Cox regression analysis between FRGs expression and overall survival. (D) Protein-protein interaction network of candidate genes. (E) Correlation network of candidate genes. DEG, differentially expressed gene; HR, hazard ratio; G6PD, glucose-6-phosphate dehydrogenase; FRG, ferroptosis-related gene.
