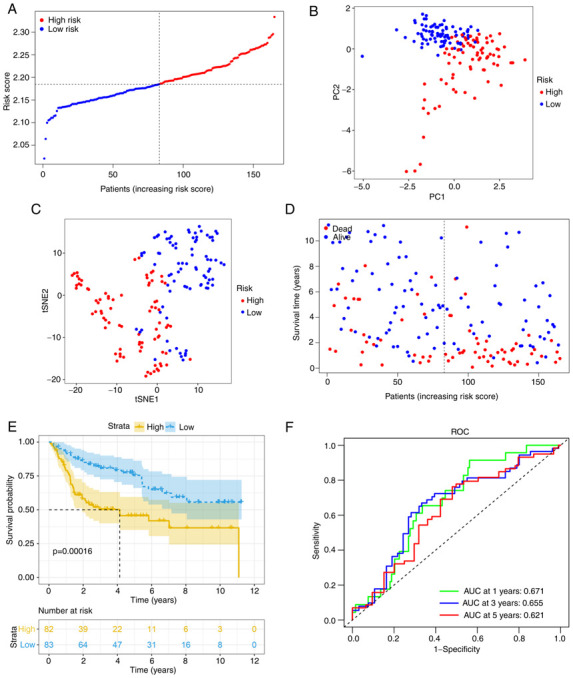
Figure 4.

Validation in the Gene Expression Omnibus cohort. (A) Risk score distribution and median value. (B) PCA plot. (C) t-SNE analysis. (D) Survival status distribution. (E) Kaplan-Meier curves for patients in different risk groups. (F) The AUC of time-dependent ROC curves was determined to confirm the prognostic performance of the risk score. ROC, receiver operating characteristic; AUC, area under the ROC curve; PC, principal component; t-SNE, t-distributed stochastic neighbor embedding.
