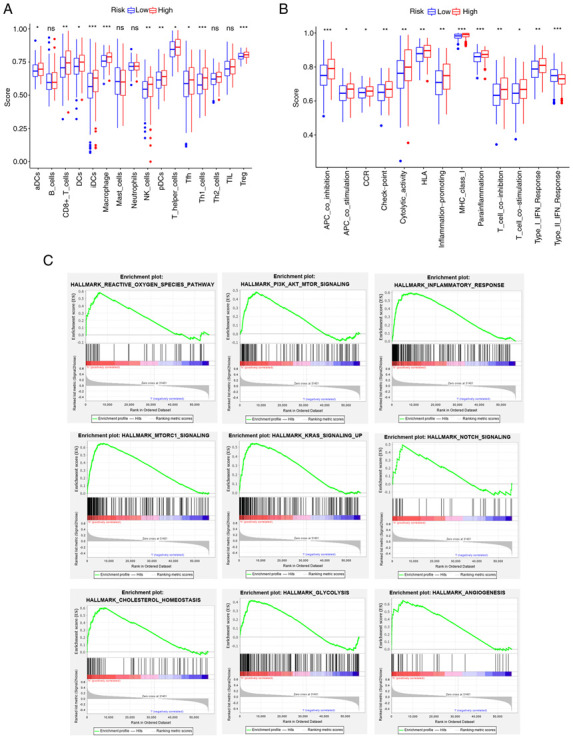
Figure 8.

Results of single-sample GSEA and GSEA analyses for the high- and low-G6PD groups in The Cancer Genome Atlas cohort. (A) Differences in immune cell infiltrating score. (B) Differences in infiltrating score in immune-related pathways. (C) GSEA results of hallmark gene sets for the high G6PD expression group. ns, not significant; *P<0.05; **P<0.01; ***P<0.001. GSEA, gene set enrichment analysis; G6PD, glucose-6-phosphate dehydrogenase. DC, dendritic cells; NK, natural killer; Tfh, follicular helper T cells; Th1, type I T-helper cells; TIL, tumor-infiltrating lymphocytes; Treg, regulatory T cells; HLA, human leukocyte antigen; APC, antigen-presenting cell; MHC, major histocompatibility complex; CCR, chemokine receptors; pDCs, plasmacytoid DCs; aDCs, activated DCs; iDCs, immature DCs.
