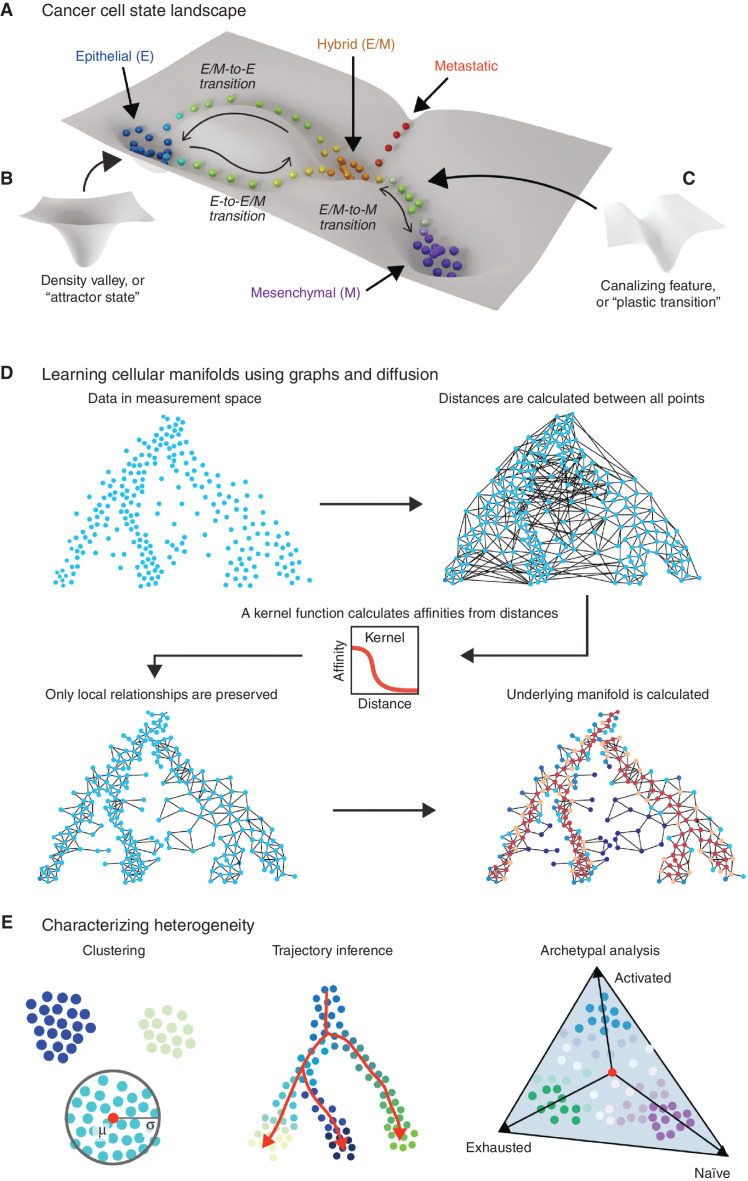
Figure 1.
Estimating the topology of the cancer cell state landscape via manifold modeling. Cancer cell populations reside in a high-dimensional state space that can be conceived as a landscape (A) in which highly populated “attractor states” constitute valleys (B) and the trajectories of “plastic transitions” between these states follow canalizing features such as channels (C). The height or depth of topologies on this landscape reflect the relative favorability of the corresponding cell state in thermodynamic or informational terms. D, The topology of cell state landscapes can be modeled using graph representations that approximate nonlinear but locally continuous “cellular manifolds.” Learning a graph from high-dimensional data such as single-cell RNA sequencing involves calculating global distances and then connecting adjacent neighborhoods of cells using a kernel function. Methods like diffusion, modeling random walks on the connected graph, can be used to estimate recurring trajectories within the data, reflecting plastic cell state transitions. E, Given the estimation of a manifold representing the cell state landscape, tasks like clustering (left), trajectory inference (center), and archetypal analysis (right) of phenotype composition can be performed to extend biological inferences. E, epithelial; E/M, epithelial/mesenchymal; M, mesenchymal.

