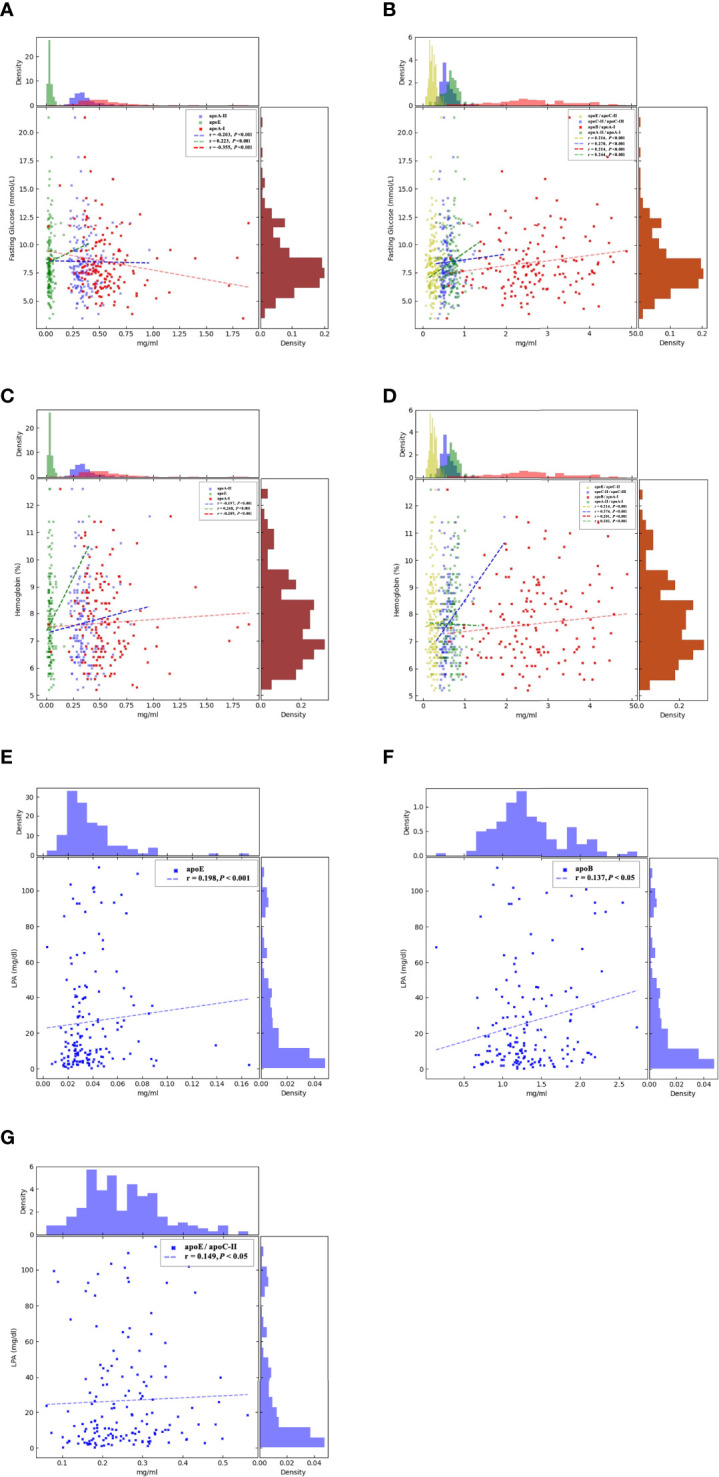
Figure 2.

Correlations between the circulating levels of fasting glucose, hemoglobin, LPA, and the apolipoproteins by Spearman’s rank correlation coefficient analysis. (A): apoA-I (p < 0.001) and apoA-II (p < 0.001) were significantly negatively correlated with fasting glucose, but apoE (p < 0.001) was positively correlated. (B). apoB/apoA-I (p < 0.001), apoC-II/apoC-III (p < 0.001), apoA-II/apoA-I (p < 0.001), and apoE/apoC-II (p < 0.001) were significantly positively correlated with fasting glucose. (C). apoA-I (p < 0.001) and apoA-II (p < 0.001) were significantly negatively correlated with hemoglobin, but apoE (p < 0.001) was positively correlated. (D). apoB/apoA-I (p < 0.001), apoC-II/apoC-III (p < 0.001), apoA-II/apoA-I (p < 0.001), and apoE/apoC-II (p < 0.001) were significantly positively correlated with hemoglobin. The brown histograms on the right side represent the data distribution of fasting blood glucose (mmol/L) and hemoglobin (%). AI, atherogenic index was calculated as TC-(LDL-C)/HDL-C. API, atherogenic plasma c LDL-C/HDL-C. apo, apolipoprotein. apoE, apoB, and apoE/apoC-II were positively corrected with LPA, apoE (p < 0.001) (E), apoB (p < 0.05) (F), and apoE/apoC-II (p < 0.05) (G). LPA, Lipoprotein(a); apo, apolipoprotein.
