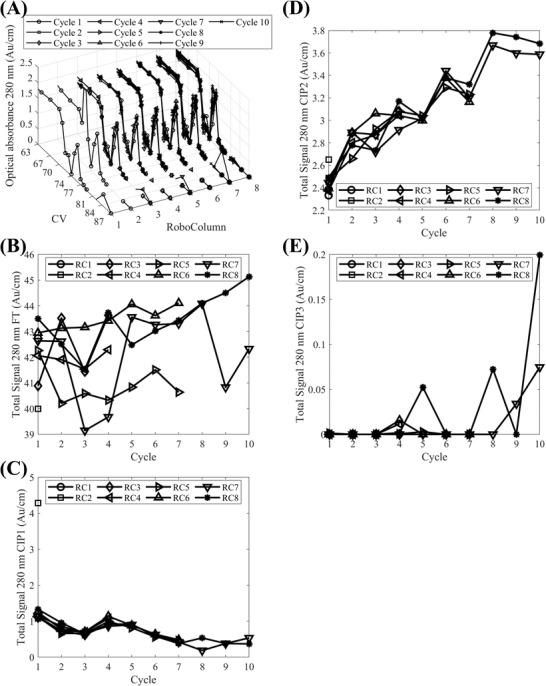
FIGURE 4.

Evaluation of the impact of the three‐step cleaning in place strategy at the high throughput scale across ten resin re‐use cycles based on chromatograms: (A) Blank and pathlength corrected optical absorbance at 280 nm per RoboColumn (RC) plotted against column volumes (CVs) across the ten re‐use cycles; (B–E) Total signals form optical absorbance measurements at 280 nm from fractions collected during the loading of the columns (FT) and the application of cleaning in place steps 1–3 (CIP1–CIP3, respectively), respectively, per RC as a function of resin re‐use cycle. In (A) the y‐axis represents the RoboColumn number and lines with markers (○), (□), (◊), (⊲), (⊳), (△), (▽), (⋆), (+), (×) correspond to resin re‐use cycles 1–10, respectively. In (B–E) lines with markers (○), (□), (◊), (⊲), (⊳), (△), (▽), (⋆) correspond to RCs 1–8, respectively. In (A) the chromatograms are zoomed in by plotting the data from the 63rd column volume onwards
