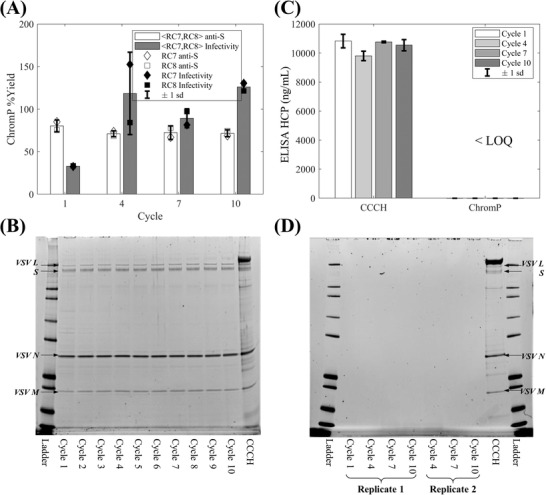
FIGURE 5.

Evaluation of the impact of cleaning in place strategy across ten resin re‐use cycles at the high throughput scale based on product yield and purity analysis and resin extract analysis: (A) Bar plot of chromatography flowthrough product pool (ChromP) yields for resin re‐use cycles 1, 4, 7, and 10, averaged across RoboColumns (RCs) 7 and 8, based on anti‐Spike (S) protein quantitative western blotting and infectivity data; (B) SDS‐PAGE analysis of clarified cell culture harvest (CCCH) and ChromP from RC8 for each resin re‐use cycle; (C) Bar plot of ELISA host cell protein (HCP) analysis results of CCCH and ChromP from RC8 for resin re‐use cycles 1, 4, 7 and 10; (D) SDS‐PAGE analysis of resin extracts obtained post‐cleaning in place the resin from RC2, RC4, RC6, and RC8 at the end of cycles 1, 4, 7 and 10, respectively. In (A) the error bars correspond to ± 1 standard deviation (sd) using the RC7 and RC8 yield data, shown by open (◊) and (□) symbols, respectively, for the anti‐S data, and closed (⧫) and (■) symbols, respectively, for the infectivity data. In (B) RC8 derived flowthrough product pools are shown since it was used across all ten resin re‐use cycles. In (D) the extracts from cycles 4, 7, and 10 were analyzed in duplicate
