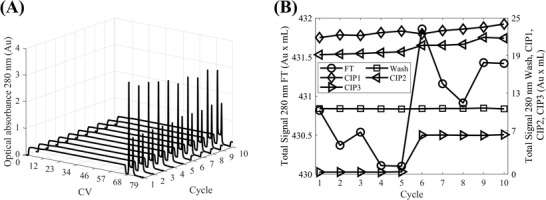
FIGURE 6.

Evaluation of the impact of cleaning in place strategy at the lab scale across ten resin re‐use cycles based on chromatograms: (A) Optical absorbance at 280 nm plotted against column volumes (CVs) across the ten re‐use cycles; (B) Total signal from integrated optical absorbances at 280 nm from effluent collected during the loading (FT) and washing (Wash) of the column, and the application of cleaning in place steps 1–3 (CIP1–CIP3, respectively) to the column as a function of column re‐use cycle. In (B), the FT Total signal is on the left‐hand side y‐axis whereas the Wash and CIP1–CIP3 Total signals are on the right‐hand side y‐axis
